-
Q3 in review
Politics and markets just don’t mix. That is the lesson to come out of the September quarter. The quarter began with wobbles on the political front – Biden out Harris in, Trump a target – progressed through yet another market wobble, this time centred around Japan, and finished with the US Federal Reserve over-delivering on a rate cut.
1. Biden out – Harris in
It doesn’t feel like it, but it was only July 21 that Joe Biden announced his decision to withdraw from the 2024 presidential race. The decision came after what has been described as “among the worst debate performances by any presidential candidate in history, if not the worst”. This came after a gunman nearly assassinated former president Trump. The voter polls have swung wildly since, away from Trump.
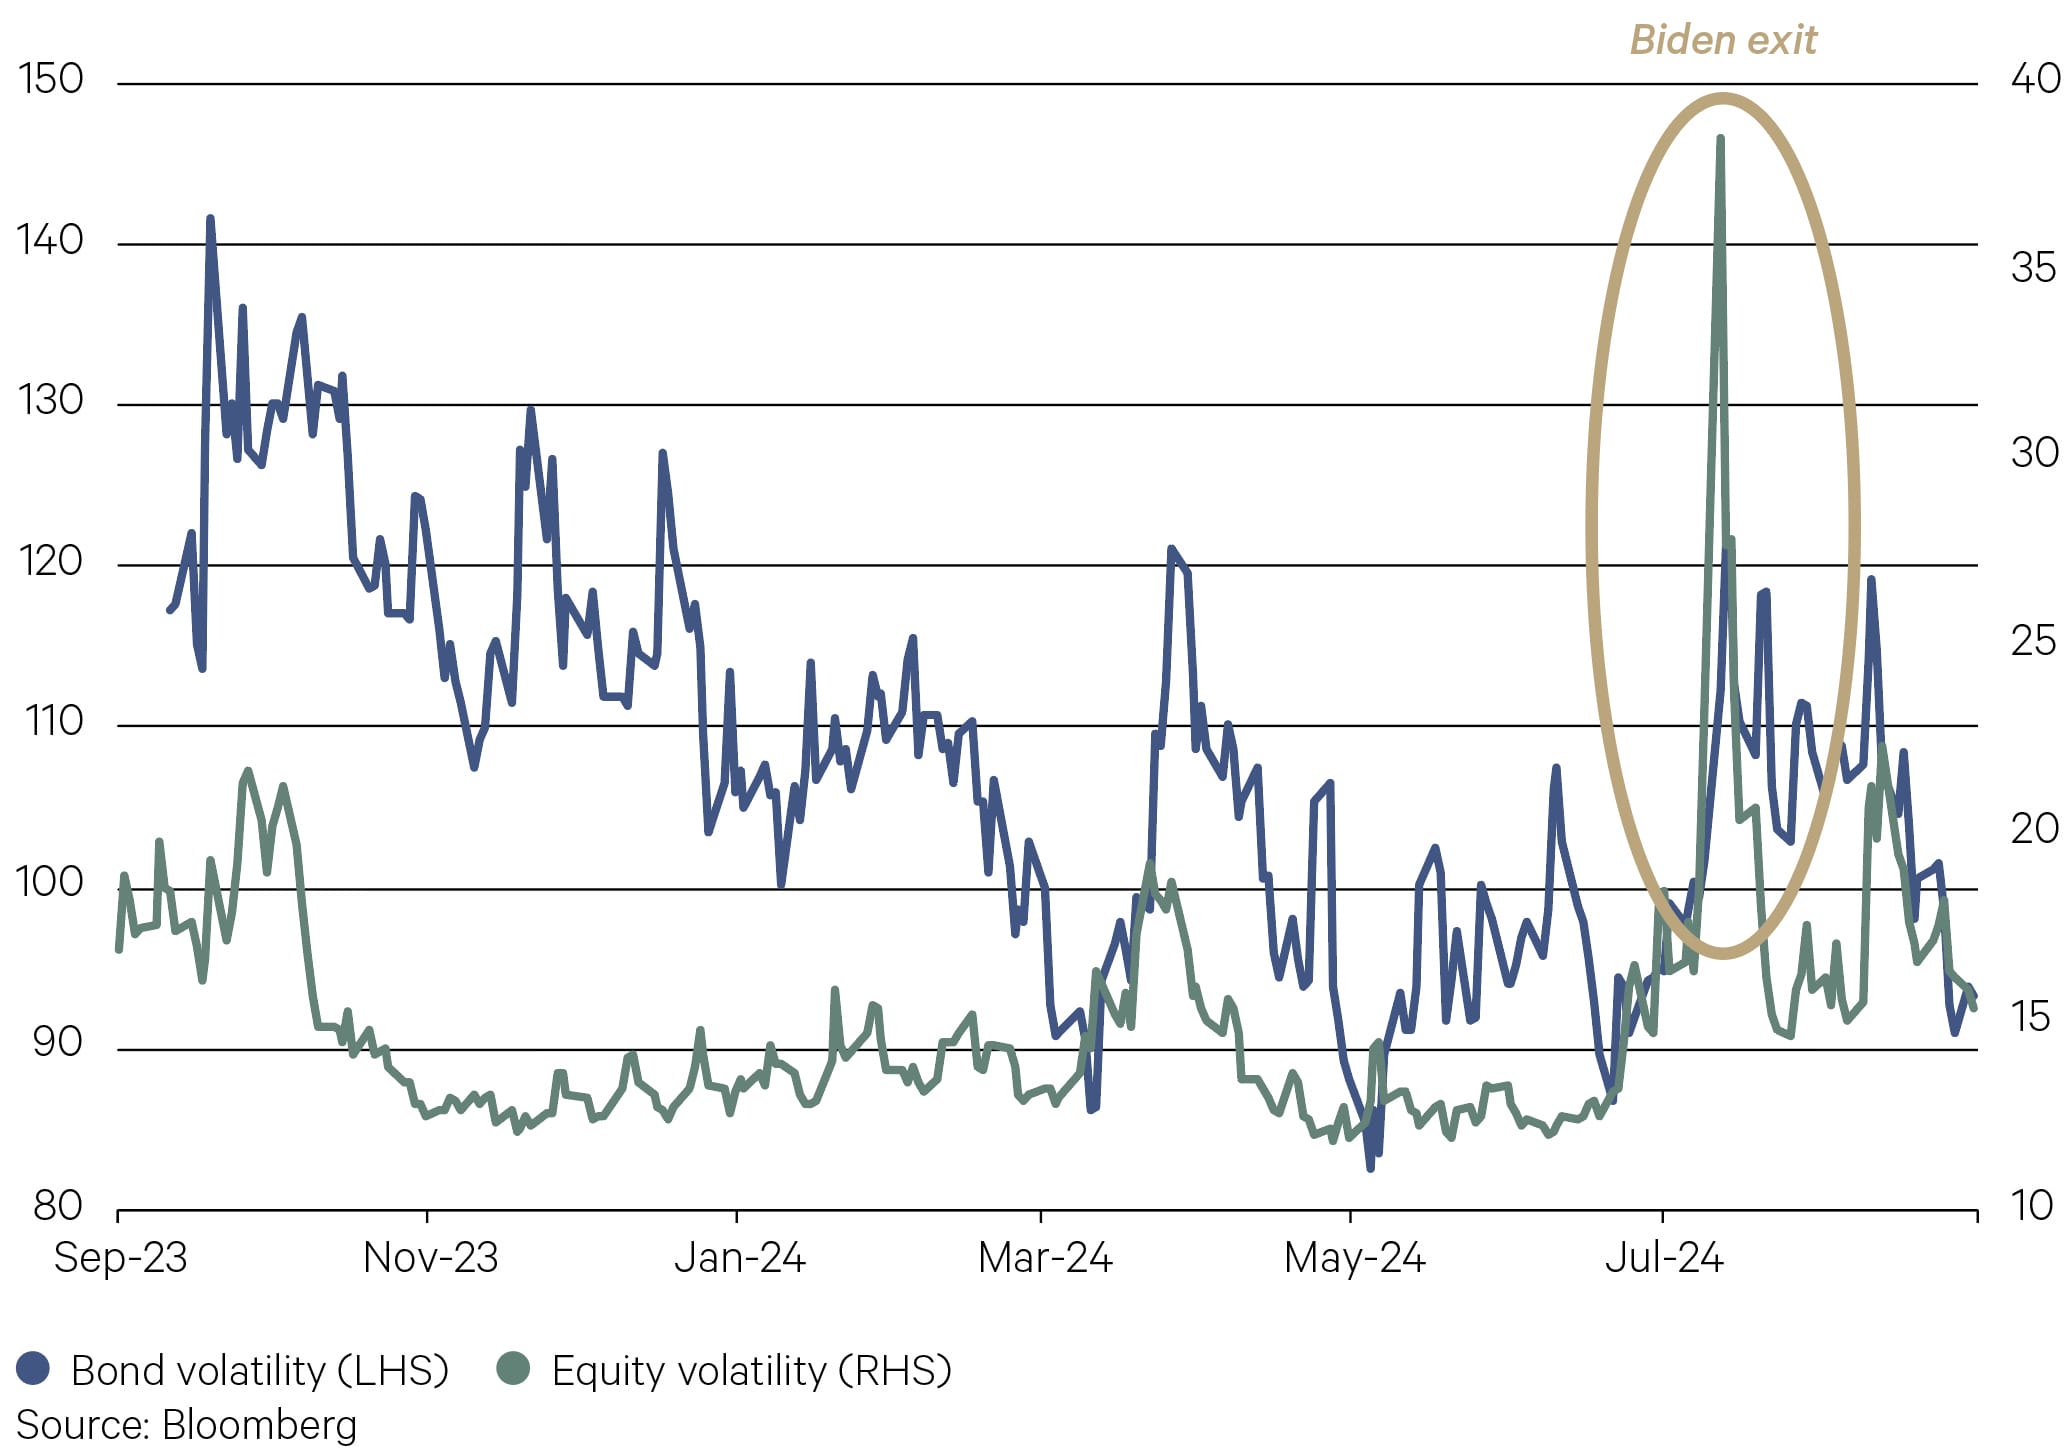
In the wake of this change, market volatility has picked up as investors position and reposition for who will win on November 5. The so called “Trump trades” reflect the former Presidents’ America first stance; his protectionist views; his pro-traditional energy platform; and his big budget perspective. Investors have interpreted a Trump win to be favourable for small cap companies, cyclical stocks, value style stocks, financials, consumer discretionary, and materials and energy companies. Bond yields and inflation may be higher under a Trump administration given his promise to cut taxes. This in turn could be challenging for longer duration growth style companies like technology.
The risk is that this view is already in the market, which means a win for Harris will see investors once again re-position. We expect volatility to rise into November.
Chart 1: Bond and equity market volatility

2. Hot August Markets
The start of August was a hot mess. The weaker-than-expected US employment report came a day after the July meeting of the US Federal Reserve where interest rates were left unchanged and two days after the Bank of Japan raised interest rates. As we now suspect, the larger than expected rate cut from the Fed at the September meeting was to make up for the mistake of not cutting at this prior meeting in July.
The combination of weaker data in the US (raising prospects of an earlier rate cut) and a rate hike in Japan sent the “carry trade” investors in a whirl. For so long, investors in Japan have been getting nothing on their savings. Interest rates in Japan have been close to zero for the past three decades. To get a return, they needed to invest overseas. So they borrowed money in Japan at close to zero percent, and bought equities in places like the US and also Australia. This was known as the “carry trade”.
This strategy works while interest rates are low in Japan and high in the US. But the evidence was pointing to the contrary and investors didn’t want to be the last out the door. What resulted was a manic Monday – the Japanese equity index, the Nikkei, experienced its largest two day fall in history.
As with previous bouts of market anxiety, this wobble proved to be temporary but it did test the nerves.
Chart 2: Nikkei Stock Index

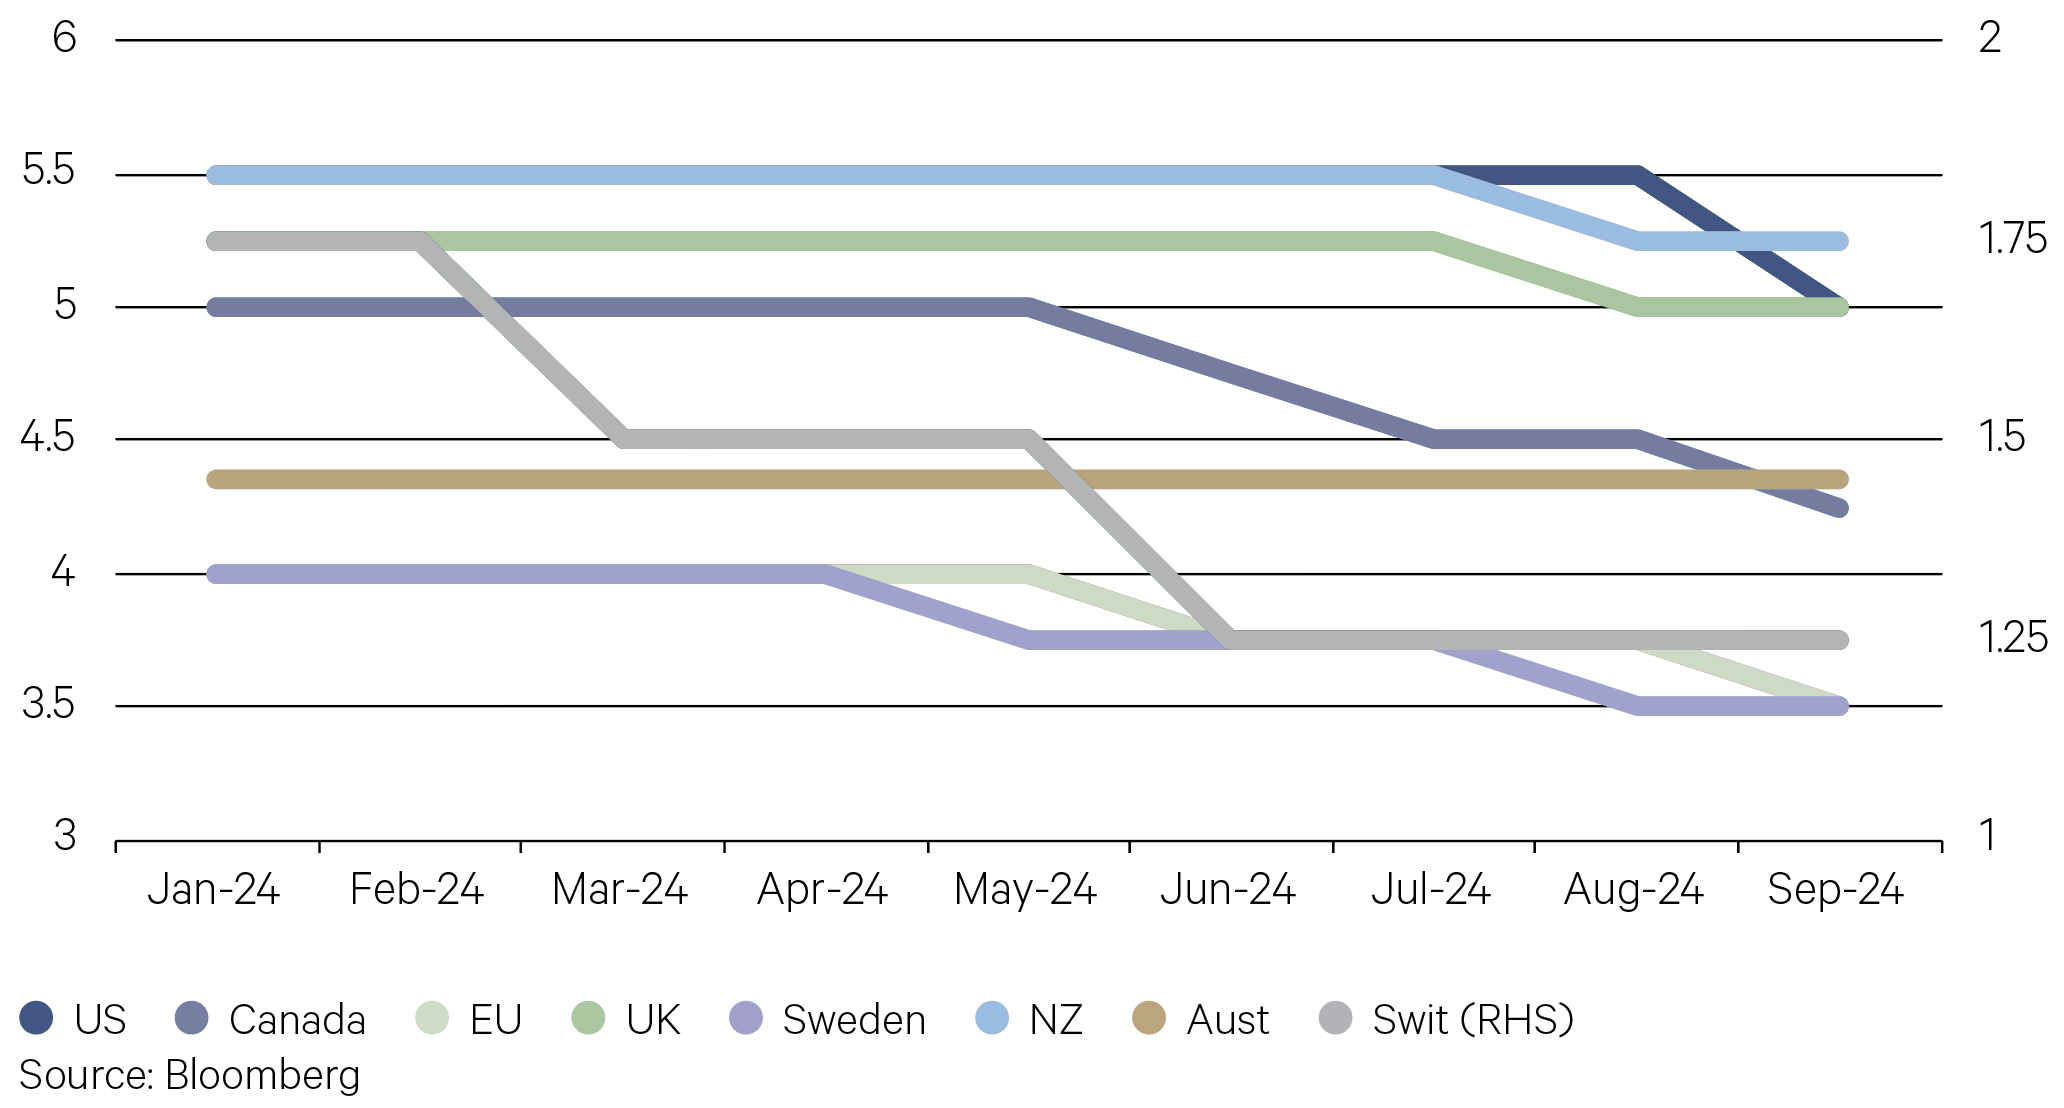
3. The rate cutting club expands
All members of the G10 (but Japan) have now cut official interest rates. The July 11 release of the US inflation report was key because it confirmed inflation was returning back to target. While a rate cut was expected at the September meeting, its magnitude was not. Just nine out of 113 economists in the Bloomberg survey expected a half percentage point cut.
The last time the US cut this much, with financial conditions as easy, was in 1992. The economy was growing at around the same rate and inflation was similar, but the unemployment rate was much higher and rising faster.
It is clear, with inflation well down from its peak and close to target, the Federal Reserve can now sequentially shift its dual-mandate focus, away from fighting inflation and toward supporting the labour market. As such, the decision by the Federal Reserve is seen as supporting the soft-landing scenario which is why US equities have hit an all-time high for the 41st time this year.
Chart 3: The easing cycle begins (official Interest rates %)

-
Australian Equities

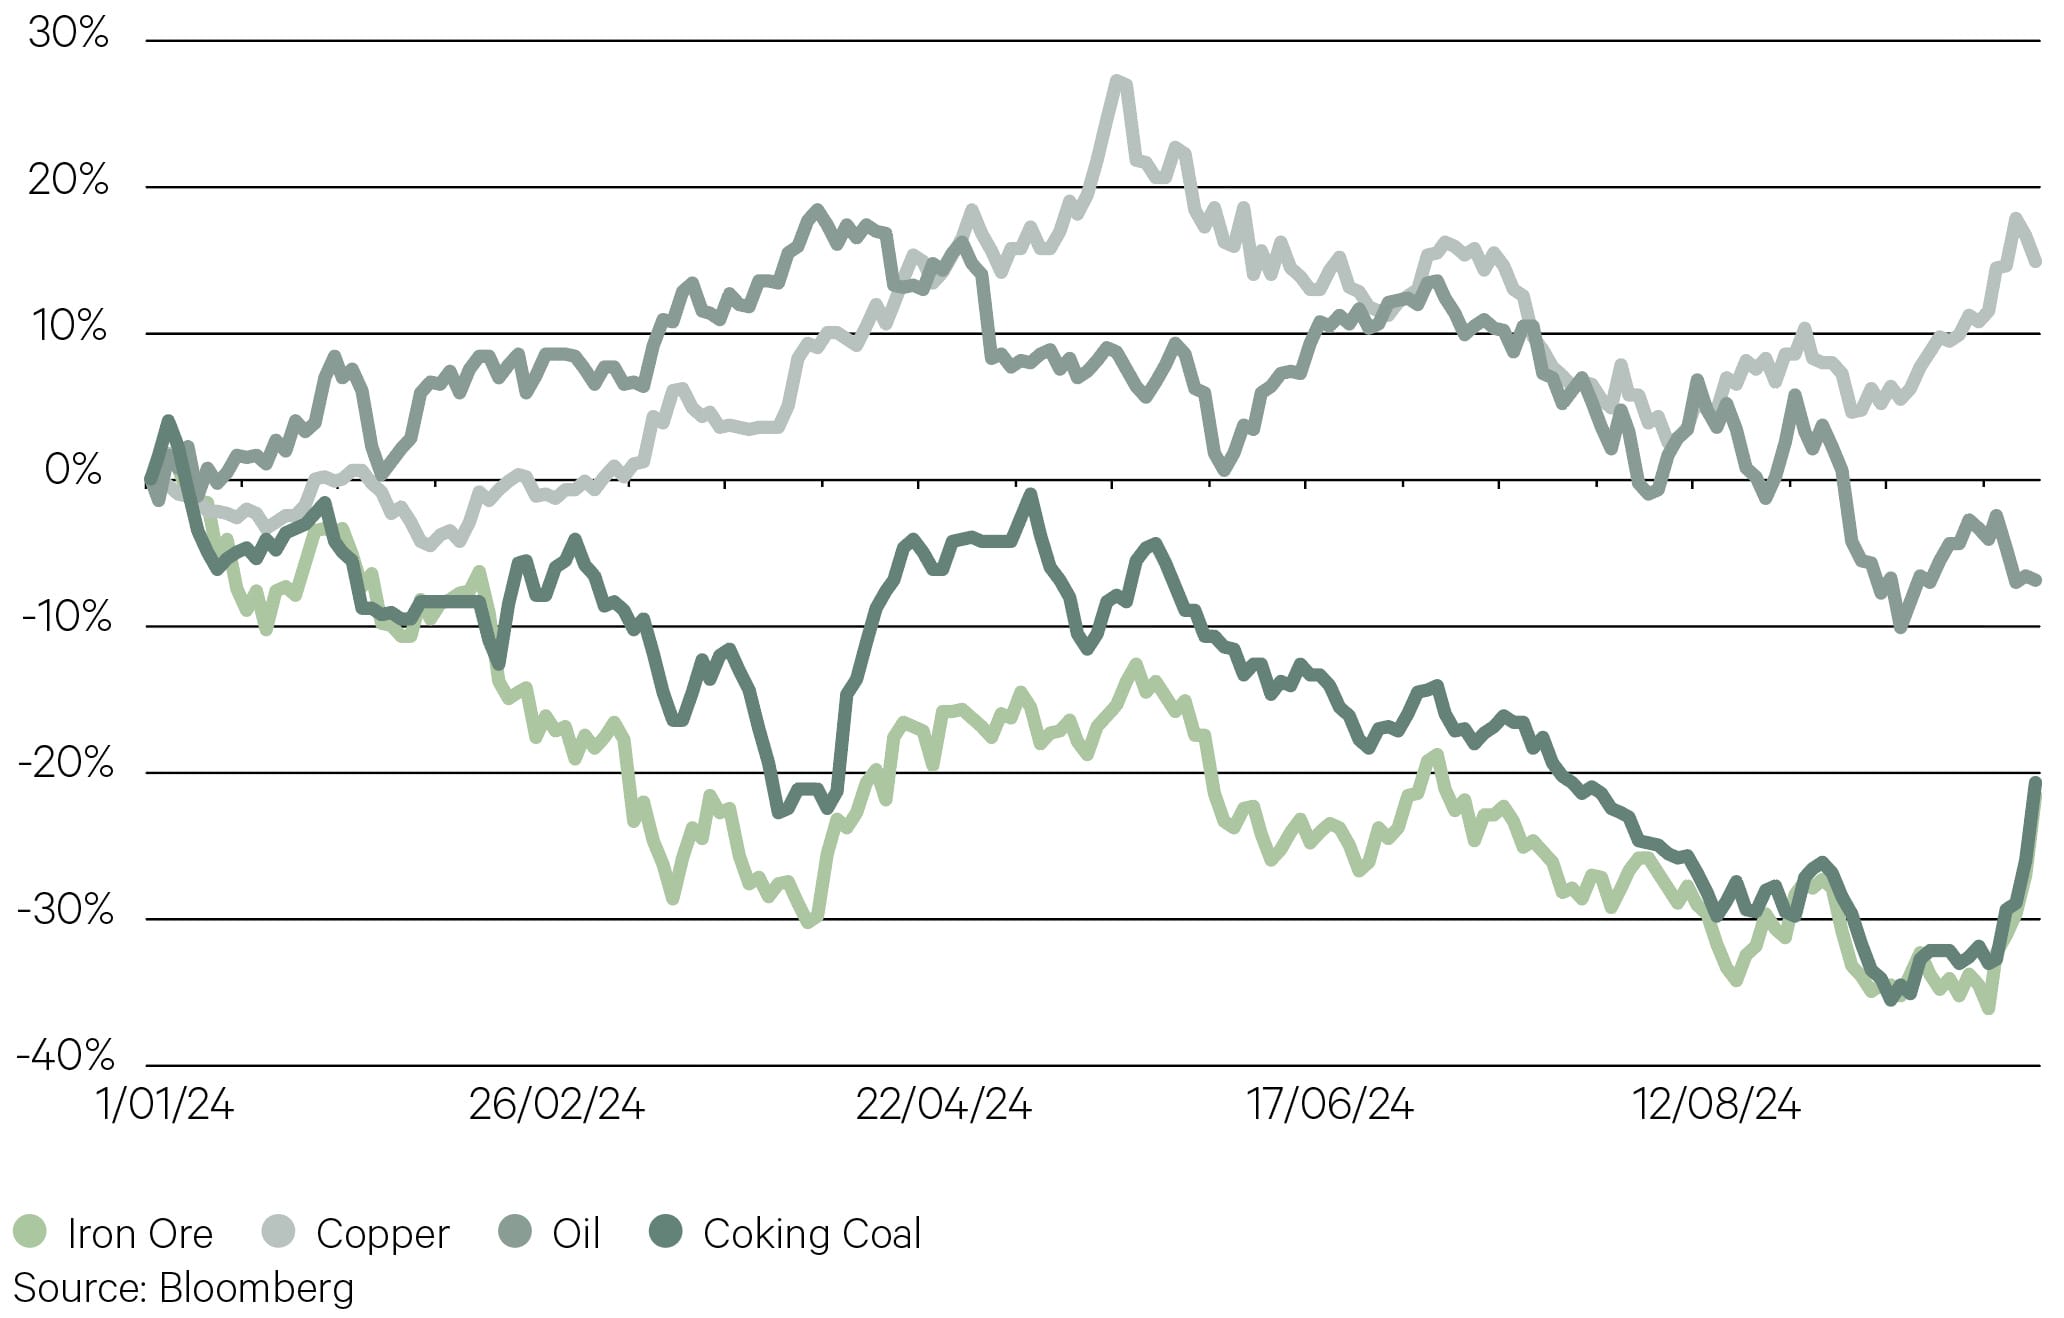
Earnings downgrades to the resources sector has been a key reason for the Australian equity market lagging global equities through 2024, driven by price declines across most commodities. China’s announced stimulus measures in late September, however, saw a partial reversal of this trend, with a strong price response across key commodities, including iron ore, coking coal and copper.
Greater confidence in a China recovery and additional stimulus would provide some sustainability to the rebound and continue the recent investor rotation that has occurred from banks to resources.
Chart 4: Commodities recover some losses in China stimulus (YTD performance %)

With earnings growth for the Australian market relatively benign, rising valuations continue to be the primary driver of equity gains.
The forward price to earnings ratio of the ASX 200 is now approaching 19x, up from a low of 12.5x in late 2022, and almost two standard deviations above its average since 2010. On this basis, only in the initial recovery period out of the pandemic has the Australian market been this expensive in the last 15 years.
Chart 5: ASX 200 forward P/E ratio at elevated levels


Key Points
-
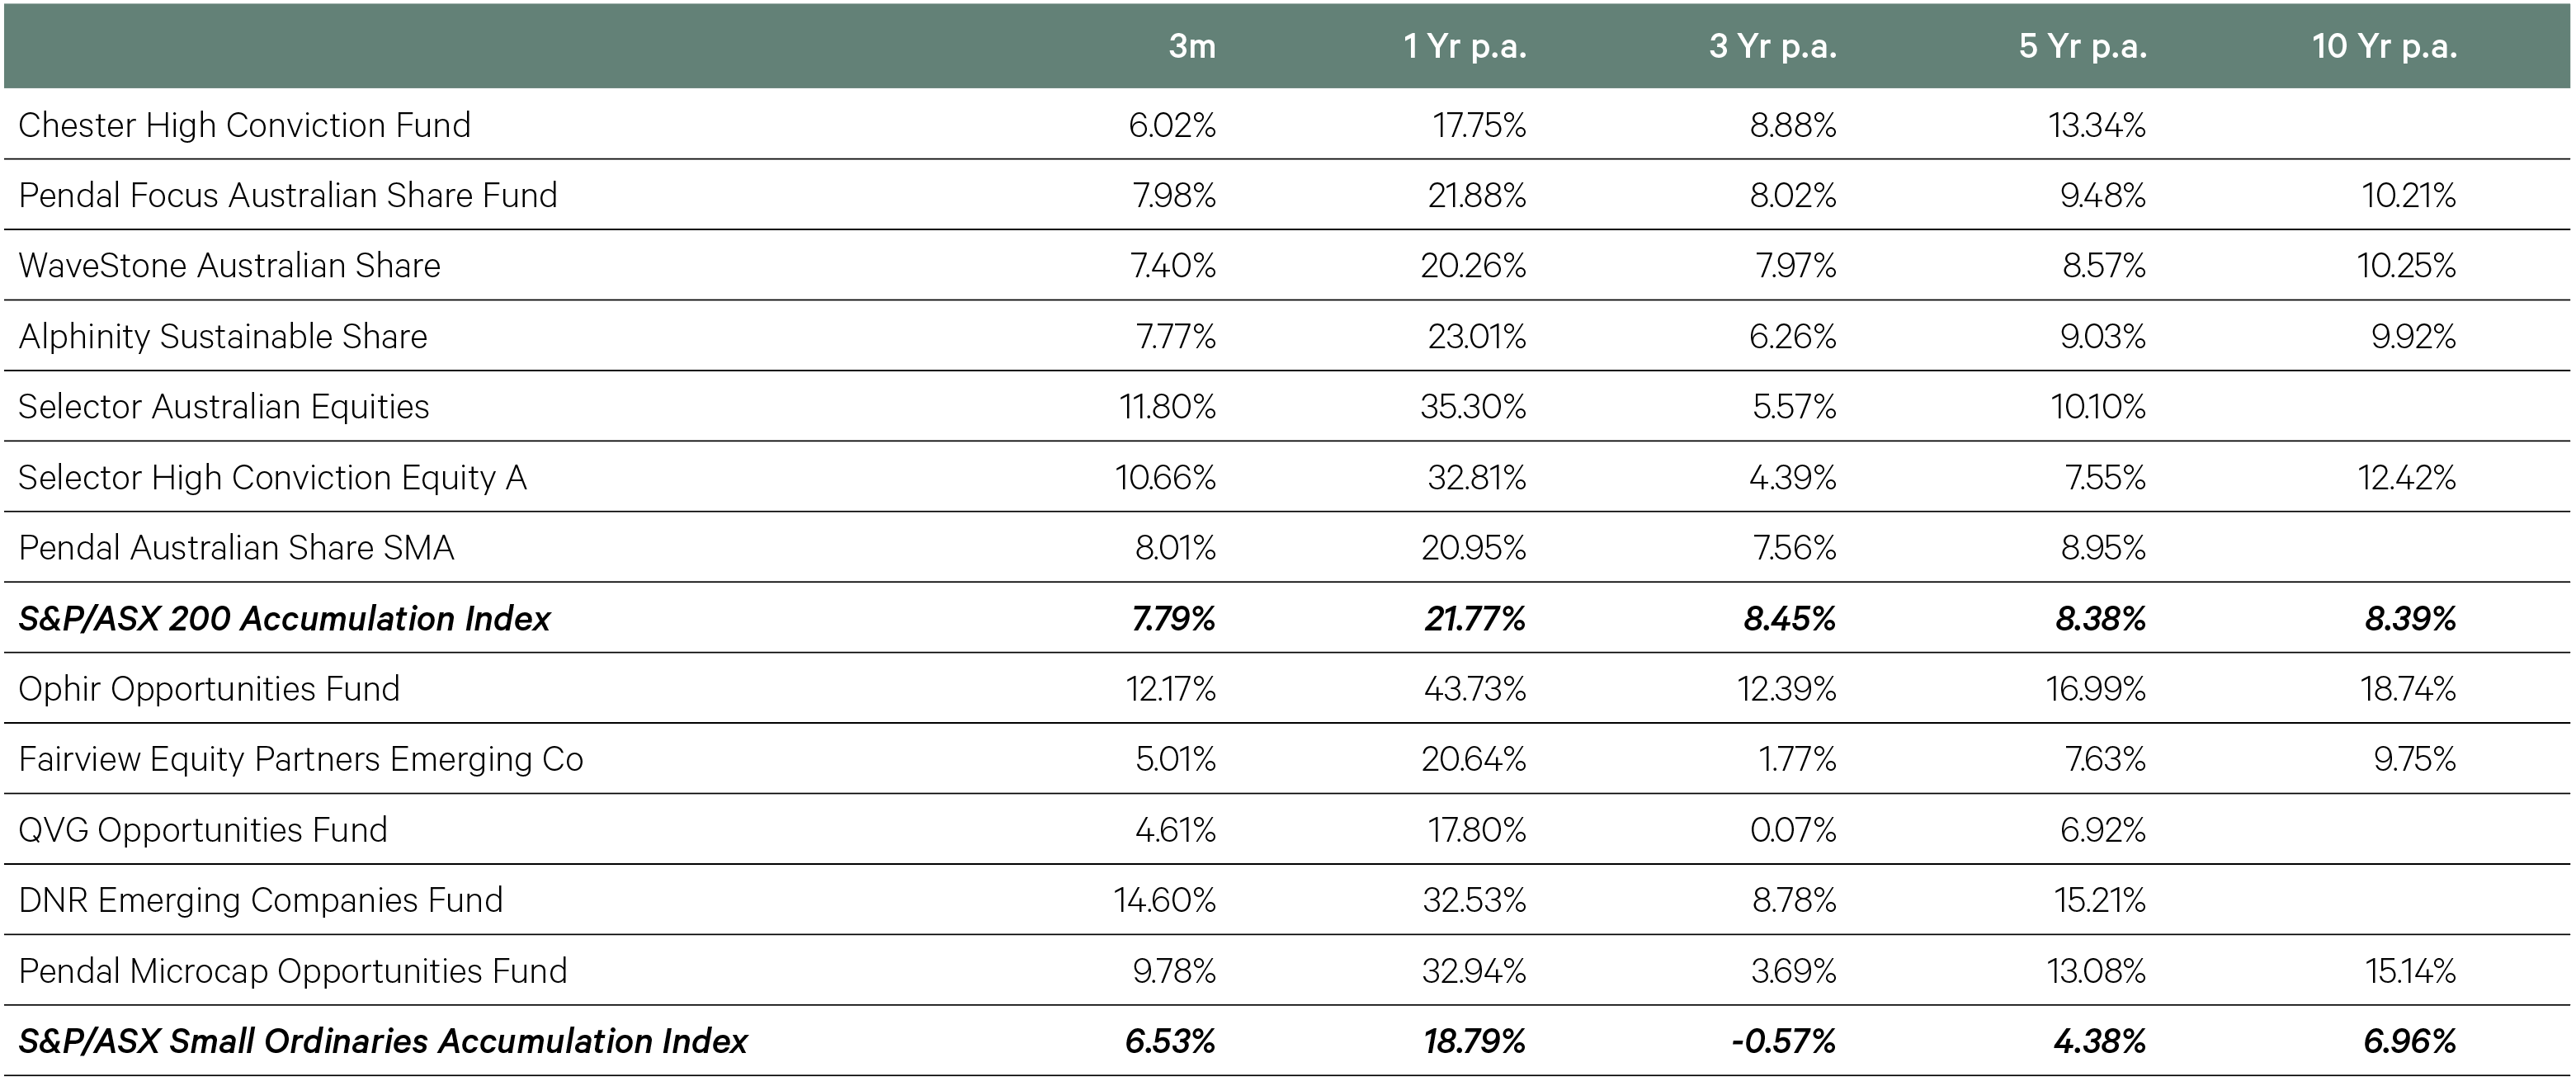
Large cap Australian equities kicked off the financial year on a positive note, advancing in each month of the September quarter to gain almost 8%. Small caps also generated positive returns, rising 6.5%, though slightly lagged large caps.
-
The robust market gains masked a high level of intra-quarter volatility from early August on weaker macro data in the US, before the market rebounded to new highs.
-
The global macro environment was again a key driver of equity returns, with the Fed’s commencement of its monetary policy easing cycle with a jumbo 50 basis point cut leading to falling bond yields and positive equity returns. While Australia is lagging the Fed and other central banks and the RBA indicating not to expect cuts in 2024, markets have nonetheless priced in easing through 2025, supporting the Australian market.
-
This was reflected in growth-orientated sectors (particularly IT and consumer discretionary) along with those that typically have higher leverage, particularly real estate.
-
Resources rallied late in the quarter on the back of the announcement of a range of stimulus measures from China, erasing the losses of the first 10 weeks of the quarter. Despite the late recovery, resources still lagged industrials over the quarter.
-
Reporting season was a key driver for individual equity returns. While results were largely as expected, forward earnings were downgraded, pointing towards a softer outlook than anticipated for FY25.
-
Selector was a key beneficiary of the strength in technology and growth stocks, leading to returns in the quarter around 4% ahead of the benchmark.
-
Our other large cap strategies generated close to benchmark returns, with Chester lagging the market, in part driven by a lack of exposure to parts of the market that have had significant momentum, including the major banks.
-
Among small caps, DNR Emerging Companies was the standout fund, generating 8% alpha for the quarter, with the manager’s rotation over the last 12 months towards quality technology and consumer discretionary stocks reaping dividends.
-
Pendal Microcaps also posted solid returns for the quarter, with the fund’s outperformance primarily generated through August’s reporting season. This added to a consistent 12 month period that has led to 14% outperformance of the benchmark Small Ords Accumulation Index.
-
-
International Equities
Two things to say about the Chinese stimulus package:
- Timing is everything. The announcement coincided with the larger than expected rate cut out of the US. A weaker US dollar helps emerging markets anyway. The stimulus will give the market an added boost, at least in the short term.
- The internal dynamics of the economy must have been really bad for President Xi to do this, who has for a long time resisted the Western practice of major support packages.
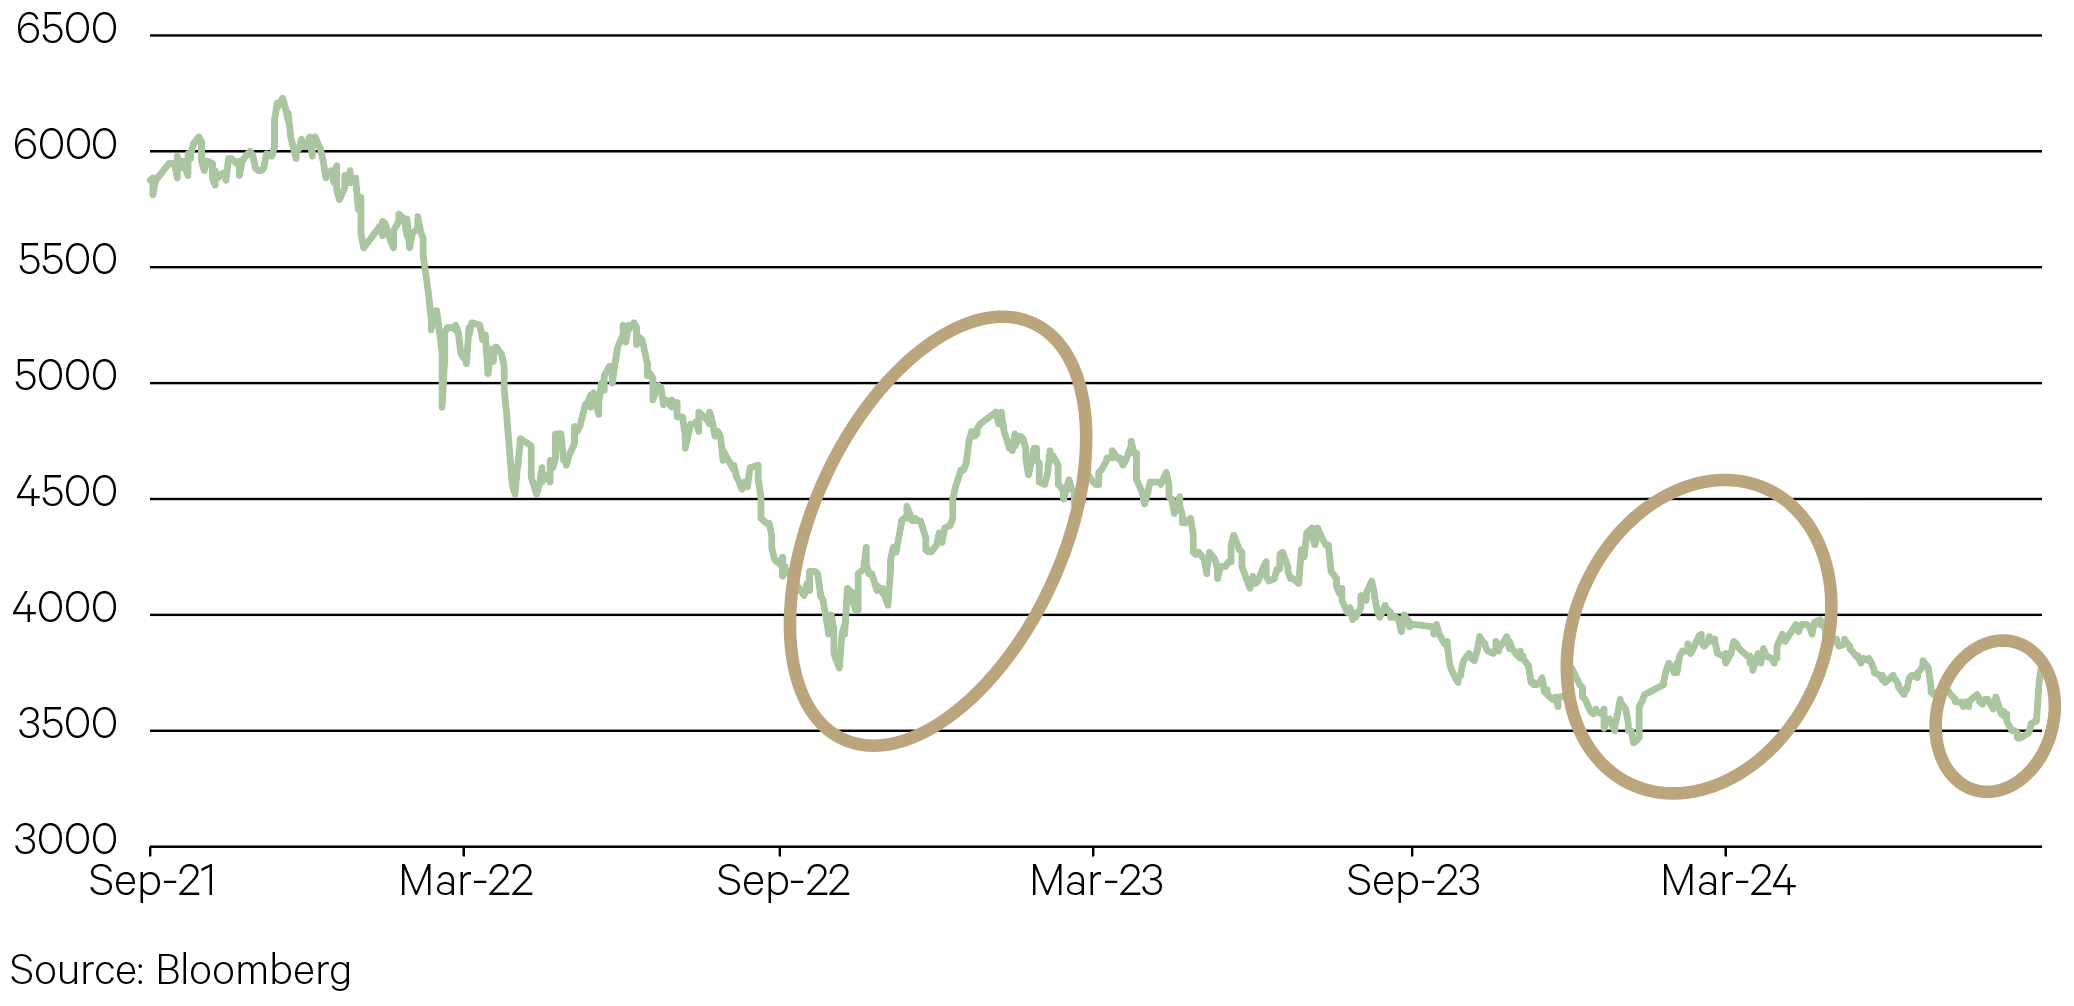
The question now is, will foreign investors buy it again as they did at the end of 2022 when Chinese equities surged 20% on the re-opening euphoria only to see a new low reached 15 months later? Another new low was hit just prior to this stimulus announcement. Let’s face it, things are not getting better in China. More household wealth has been lost as house prices continue to fall (now down for 12 consecutive months). Trade tensions between China and Japan are greater. And geopolitical risk is more intense.
Chart 6: Shanghai shenanigans

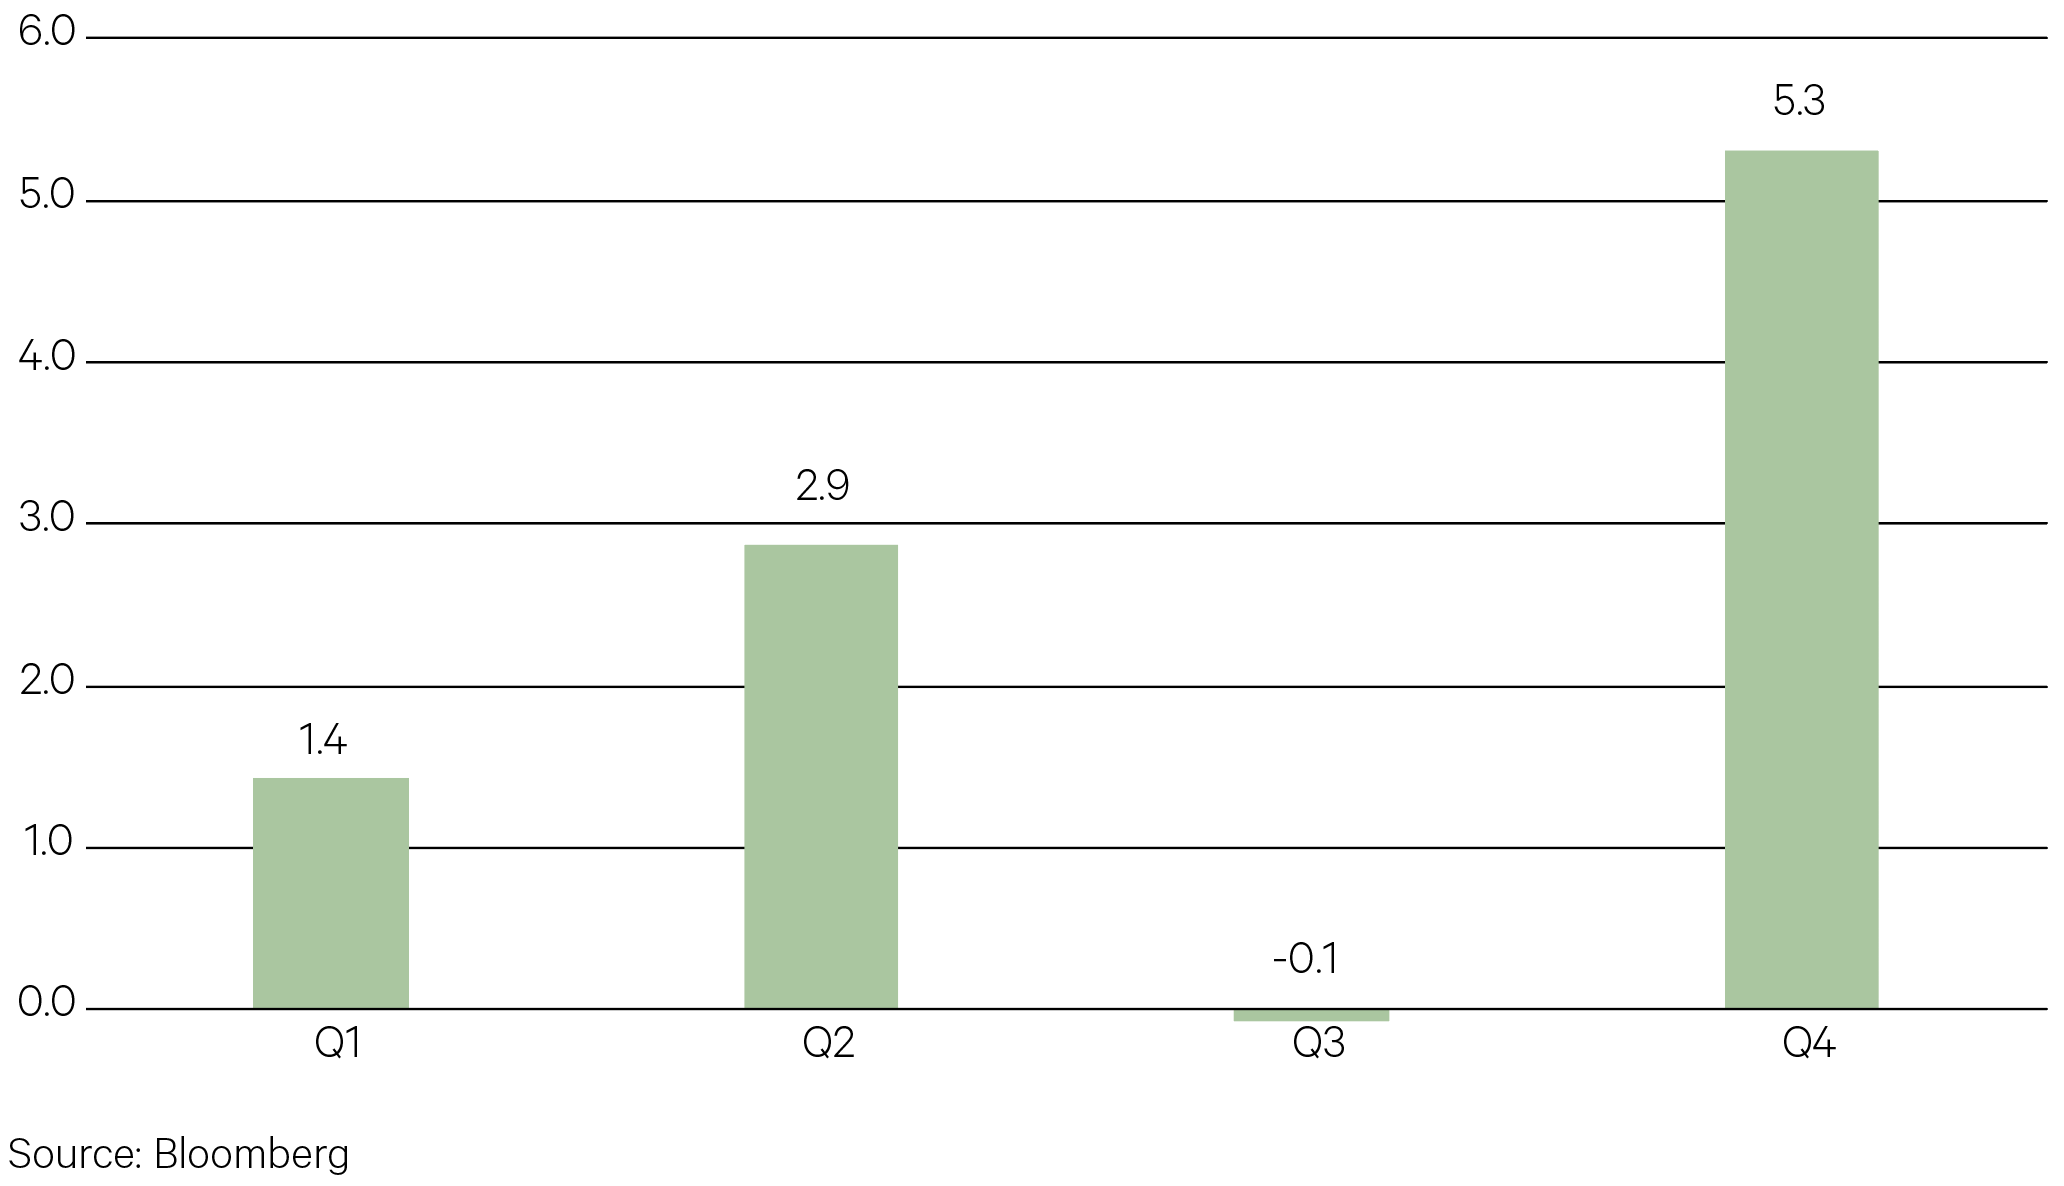
Investors are about to enter the most favourable time of the year for returns. October, November, and December are generally considered strong months for US stock markets. Over the last 30 years, the last three months of the year have been the best.
In presidential election years, the May to October period tends to be stronger than in non-election years.
Chart 7: Tis the season – average quarterly return for S&P500 over past 30 years


Key points
-
The MSCI World Index rose by 6.0% in the quarter. The rise was led by value stocks and small cap companies as a larger than expected rate cut from the US Federal Reserve spurred interest in cyclical and cyclical-sensitive parts of the market.
-
European markets rose, though lagged other global equities, with the French CAC up 2.1%, the Italian MIB up 2.9% and the German DAX up 6.0%.
-
Emerging market (EM) equities outperformed developed markets, rising by 7.7%. Chinese equities outperformed on the back of the surprise stimulus package announced by the government.
-
Technology stocks lagged as evidenced by the more modest 1.7% rise in the NASDAQ. Nvidia finished the quarterly slightly down after seven consecutive quarterly gains and has still posted a rise of almost 150% in 2024.
-
The standout currency over the quarter was the Japanese yen, which rose against every currency but in particular against the US dollar. The US dollar was weaker against most major currencies as investors began to price a sharp monetary policy easing cycle over the next 12 months.
-
Interest rate-sensitive markets in real estate and infrastructure had a significant benefit from falling long bond yields on the back of the shifting expectations for monetary policy in the US. The Quay and ClearBridge RARE funds were among the winners from this tailwind, with double-digit returns generated across the quarter.
-
Our value funds were the better performers over the quarter, which in part was driven by the lower exposure of these funds to technology. This was particularly the case for the Barrow Hanley Fund and our new ClearBridge Global Value Improvers Fund.
-
GQG Global Equities was a laggard among our large-cap global equities funds in the September quarter, in part driven by the underperformance of companies linked to the rise in weight-loss drugs, including Eli Lilly and Novo Nordisk.
-
Emerging market funds were largely driven by their relative exposure to China. This supported Fidelity Asia in late September and was a headwind for GQG’s performance.
-
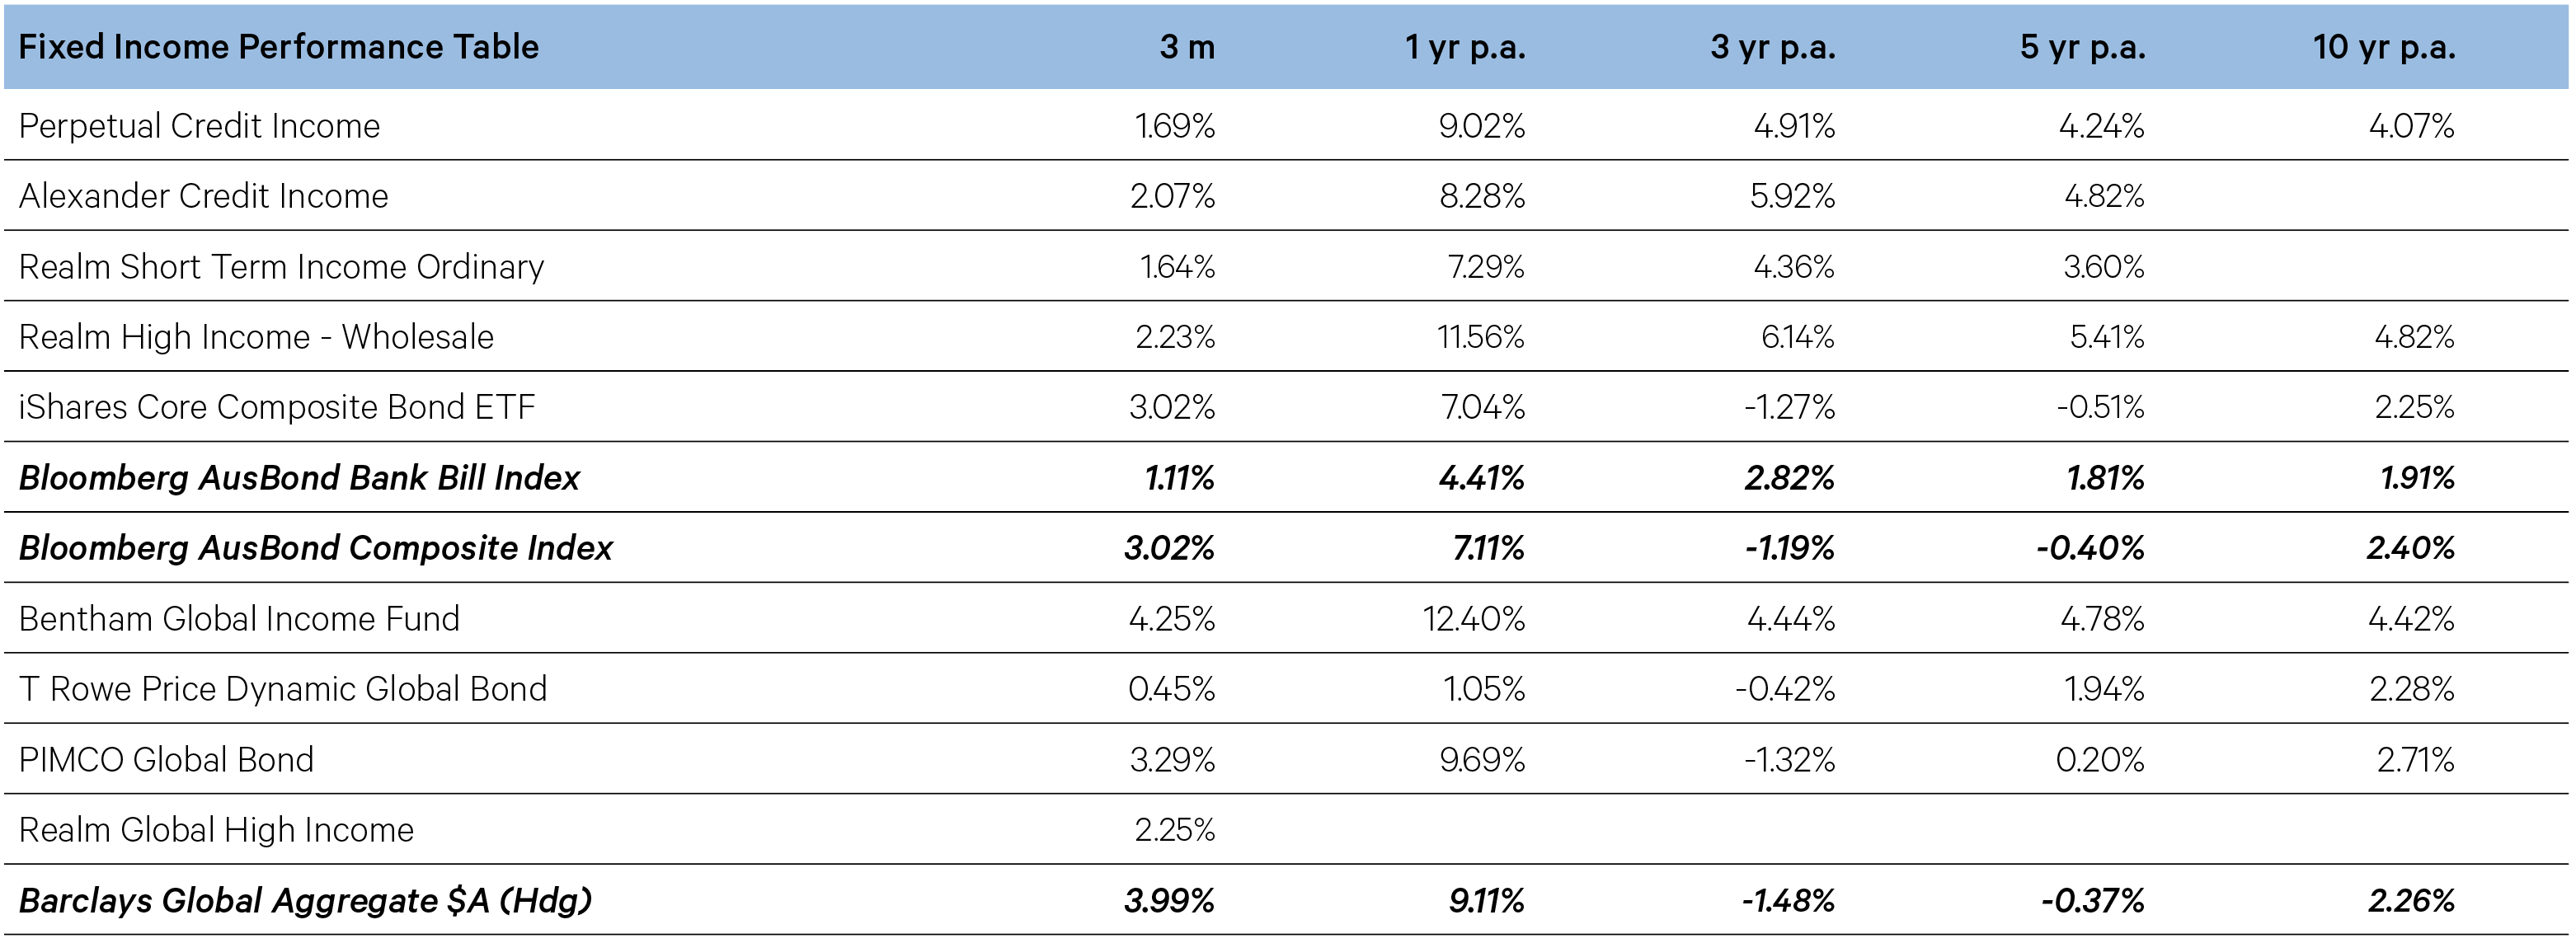
Fixed Income
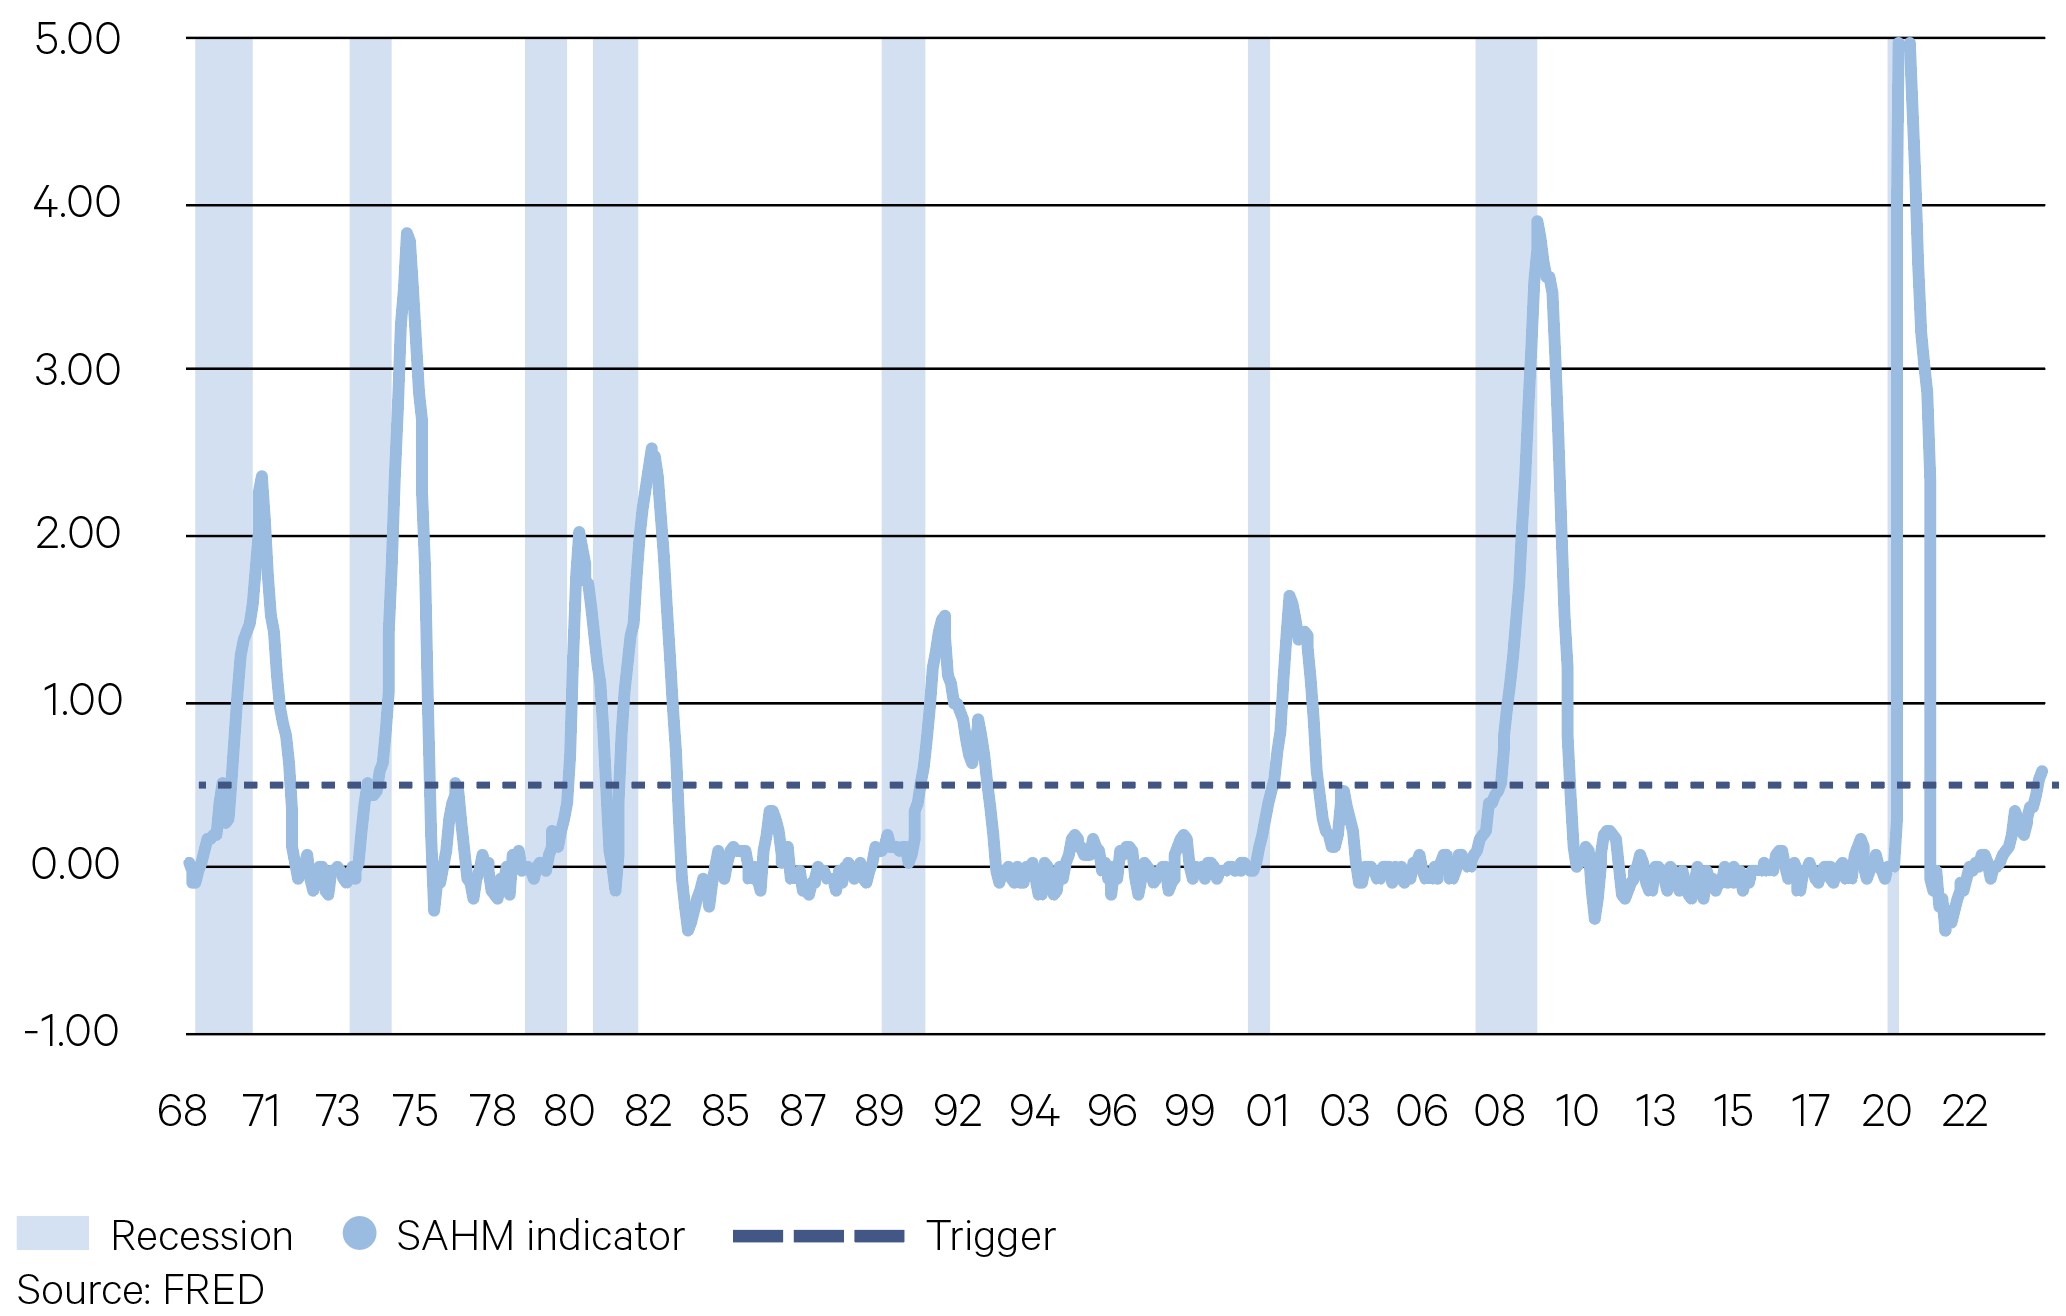
A jump in US unemployment figures sparked unease in markets in late July as the so-called “Sahm rule” was triggered. Historically, the triggering of the Sahm rule has indicated that the economy is in the midst of a recession. The rule is triggered when the three-month moving average of the national unemployment rate rises by 0.5% or more relative to its 12 month low.
However, many economists and even Claudia Sahm herself believe this cycle is different – continued growth, above target CPI and a still-tight labour market suggest conditions are still looking ripe for a soft landing. Nevertheless, the FOMC was spurred into action, delivering an outsized first cut to protect the labour market from further weakening.
Chart 8: Sahm Rule indicator triggered

As the US election approaches, focus has drawn to the sustainability of government borrowing. Since 1960, the debt ceiling has been raised 78 times as the budget deficit continues to grow. In the wake of increased spending over the Covid-19 pandemic, public debt levels now sit at US$35 trillion–over 120% of GDP. As it stands, the interest alone on government debt is expected to top US$1 trillion in 2025, outstripping both defense and Medicare spending. Over the longer term, interest expenses are expected to make up the largest category in the Federal budget by 2051. Rate cuts may offer some relief to debt servicing in the near term, but without reining in spending (which neither major party seems prepared to do), that figure will continue to grow.
Chart 9: US Government debt to GDP rising (%)


Key points
-
Yields finished the quarter lower, with longer term yields falling sharply in the last week of July. August and September were volatile, with both the Australian and US 10-year yields hitting closing lows not seen since the first half of 2023, before retracing some ground in the back end of September to close the quarter down 34bps and 62bps respectively. Yields at the shorter end of the curve fell more steeply, reflecting the dovish expectations for rate cuts, particularly in the US.
-
A weakening US labour market prompted a bumper 50bp cut out of the FOMC’s September meeting. Bond markets initially were pricing in an aggressive series of rate cuts over the next few months, but comments from Fed Chair Powell that policy “will move over time towards a more neutral stance” and that the committee will “make [their] decisions meeting by meeting” tempered expectations as the quarter drew to a close.
-
In contrast, the RBA considered a rate hike in its August meeting but determined to keep the cash rate on hold to “best balance the risks to both inflation and the labour market”. The cash rate has now been at 4.35% for seven consecutive meetings. The delayed start of the hiking cycle has come back to bite the RBA, with cuts not expected for Australia until early 2025.
-
The measured cutting cycle employed by the ECB to date is expected to ramp over the next few months, as data indicates a slowdown in inflation and economic activity. A faster cutting cycle would weaken the Euro against countries with higher rates and slower cutting cycles, including the UK, US and Australia.
-
Falling yields over the quarter rewarded funds taking on interest rate duration. As a result, Bentham Global Income and PIMCO Global Bond outperformed over the period.
-
Our floating rate credit funds continue to benefit from higher all in yields, particularly those with access to the broader global universe beyond Australia.
-
-
Alternatives
In H1 2024, US PE middle-market buyout value and count increased by approximately 12% versus the same period in 2023. The increase can be attributed in part to the better financing terms being offered to middle-market deals. Banks have also resumed lending to PE borrowers and are competing head-to-head with private credit lenders in the refinancing market, causing spreads to contract. Collateralized loan obligations (CLOs) saw record issuance in H1 2024, with middle-market CLOs accounting for 19.6% of the total, more than double from its share just two years ago. The strong growth of CLOs as buyers of middle-market loans translates to a more liquid market and improved access for middle-market borrowers.
Chart 10: US PE Middle Market Deal Activity

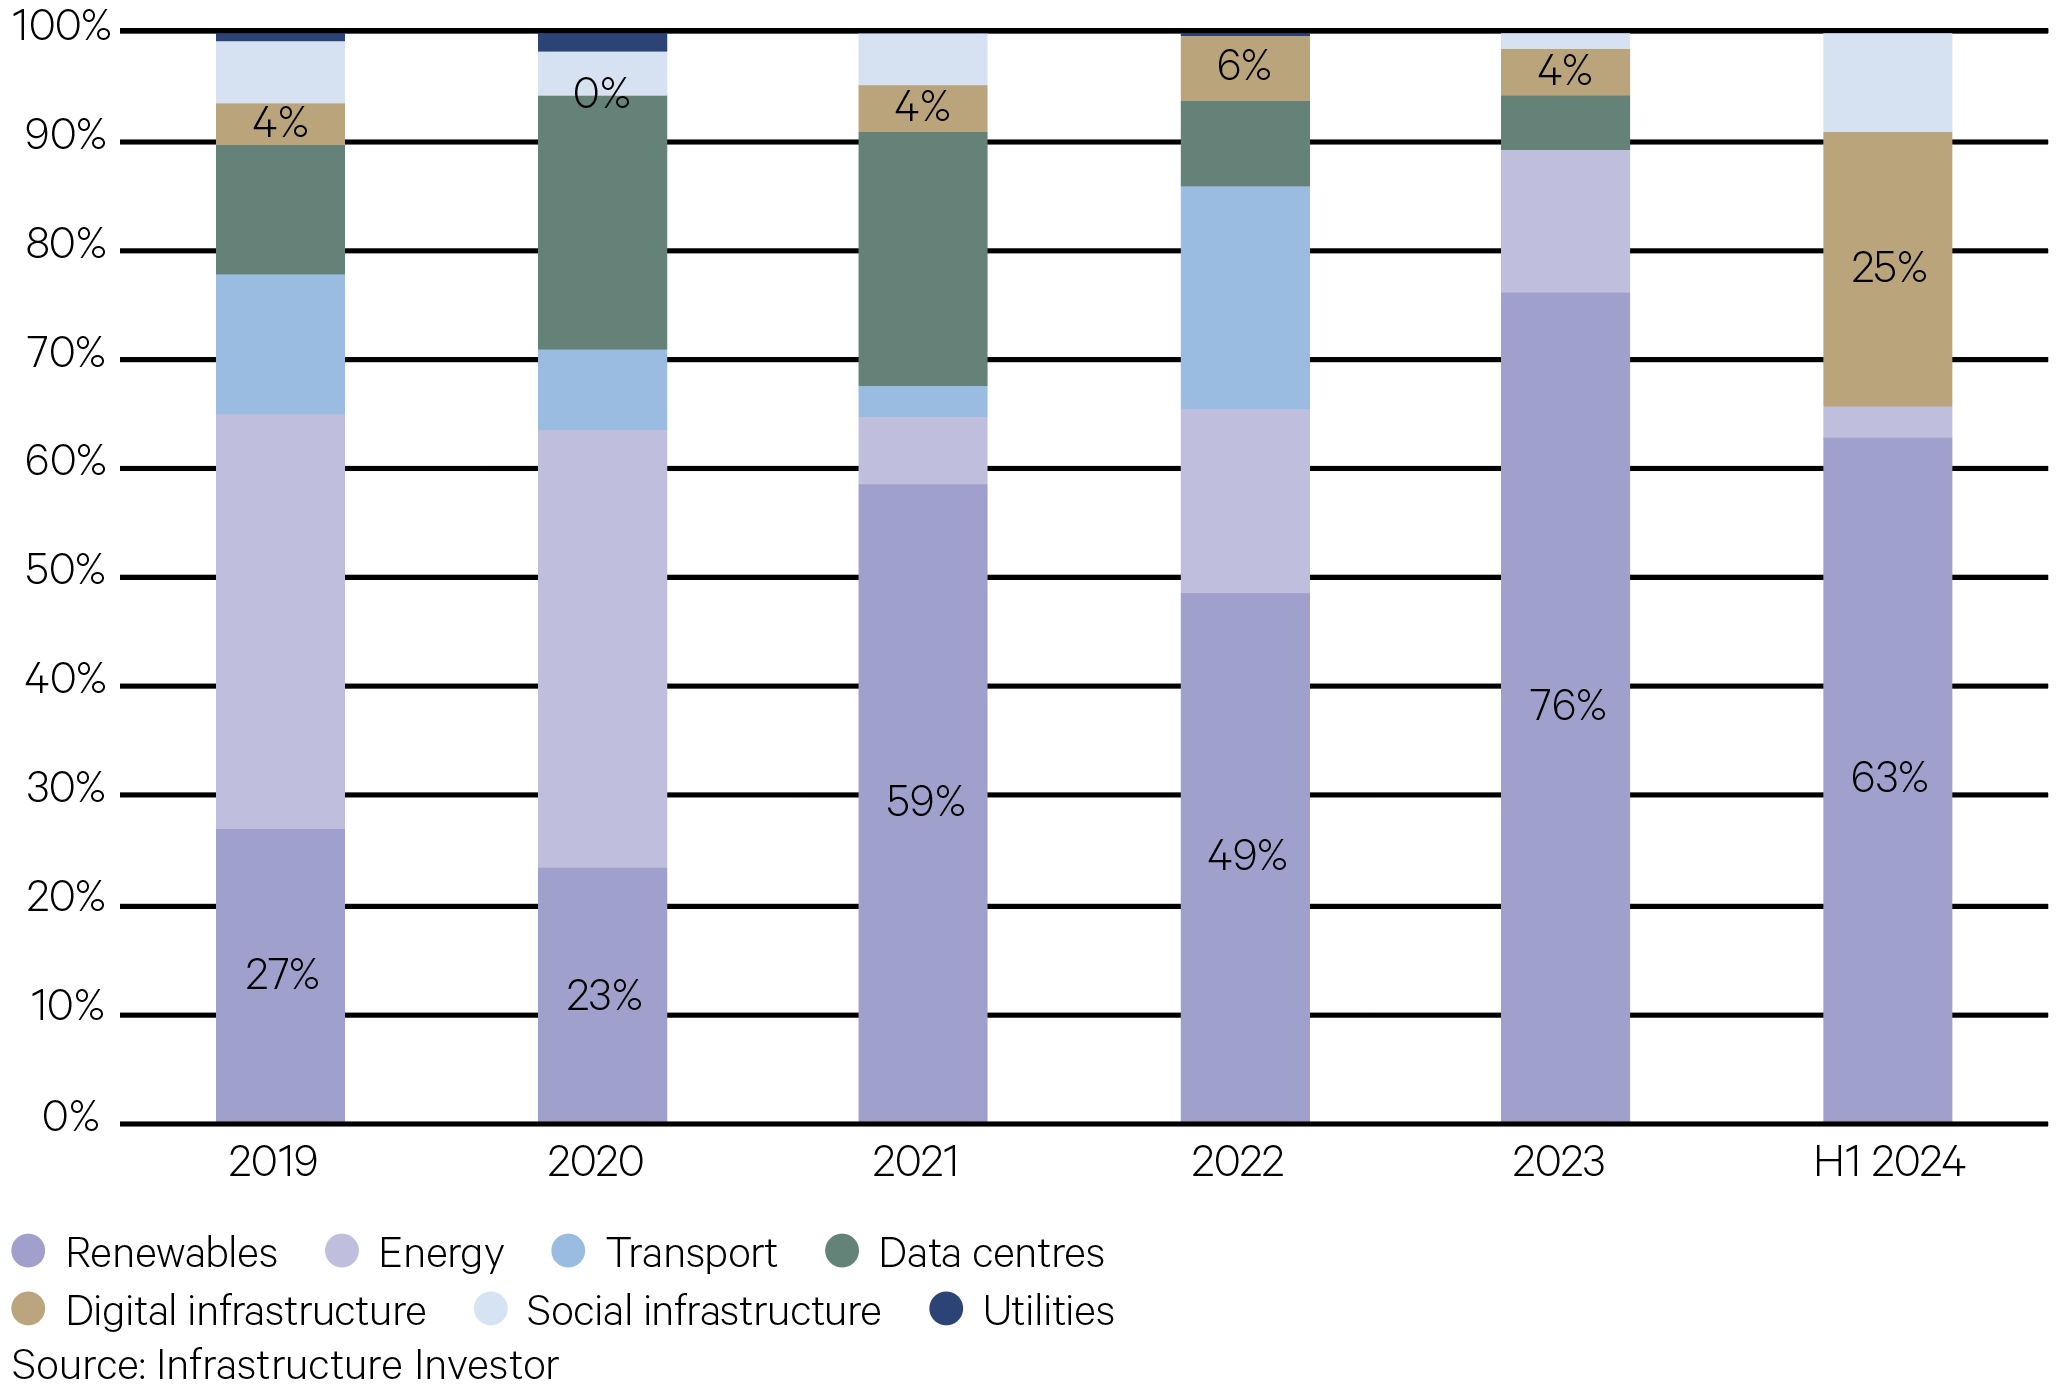
Renewable energy and digital infrastructure dominate the focus for infrastructure investors due to the global push towards achieving net-zero carbon emissions by 2050. This presents significant investment opportunities estimated at ~$6.7 trillion annually. Additionally, to the AI revolution, the demand for digital infrastructure assets such as data centres and fibre networks is likely to more than double in the coming years. The energy intensive nature of generative AI means the intersection of both themes will require capital investment to meet this surging demand. In H1 2024, 88% of new capital raised by infrastructure investors were for energy transition and digital infrastructure assets.
Chart 11: Renewables and Digital Infrastructure Dominate Fund Raising


Key points
Private Debt
-
Merricks Partners added 2.2% for the three months ending August 2024. Underlying loan income performed strongly across the quarter, with floating rate loans continuing to pass through rising interest rates in Australia and New Zealand. The portfolio currently comprises senior secured loans diversified across fourteen sub-sectors and is additionally diversified by geographic spread and borrowers. Credit default swap (CDS) protection continues to provide the Fund with a cost-effective macro credit hedge. The Manager continues to see a strong pipeline of opportunities across residential, commercial mixed-use, mixed farming, dairy, and specialised processing assets, and expects the Fund to remain fully deployed through 2024.
Property
-
Commercial Real Estate (CRE) markets continue to soften as valuations in subsectors such as office and retail continue to weaken. Transaction volume across all areas of CRE remain well below long-term averages and capitalisation rates have softened further in areas such as office, retail and industrial. The Charter Hall Direct Office Property Fund fell on its most recent full valuation cycle as valuations across the industry fell. Property Fund Managers are pointing to lower quality in the transactions currently taking place and a focus on prime and A grade buildings where Charter Hall have been positioned for some time.
Infrastructure
-
The Macquarie Private Infrastructure fund was flat over the June 2024 quarter. The fund benefitted from positive performance for the majority of its Australian unlisted infrastructure exposure. Offsetting this was unfavourable USD and EUR currency movements in relation to the fund’s international exposures and negative performance from the Americas unlisted infrastructure exposure. At an asset level, the Australian Airport Assets, NSW Land Registry Services and the Port of Newcastle were notable positive contributors to returns, while the two largest detractors were Medical Properties Partnership and DTG Recycle in the U.S.
-
The Morrison Infrastructure Partnership Fund added 2.97% for the three month period to Jul-24 and is up 15% over the trailing twelve months. The biggest contributors were the funds exposure to digital infrastructure assets which have seen significant pick up in demand in recent quarters.
Private Equity
-
Private equity (PE) deal activity continued its recovery after experiencing several consecutive quarters of minimal activity. Deal flow in Q3’24 was 50% higher than the same period a year ago as uncertainty around financing costs for dealmakers eased and the gap between buyer valuations and seller expectations narrowed. With this, PE investors are broadening their opportunity set with increased activity in areas such as take-privates, carve-outs and growth equity deals all seeing an uptick in recent quarters.
-
For the three months to Aug-24, Partners Group Global Value gained 0.7% while Hamilton Lane Global Private Assets finished up 1.9%. Partners Group gained from industrial manufacturing and safety positions on the back of stronger earnings performance. Hamilton Lane gained on the back of positions in buyout secondaries and co-investments in the consumer discretionary industry.
Hedge Funds
-
L1 Capital Long Short returned +2.1% over the September quarter driven by broad-based stock gains in the long book. Names such as Rightmove, NatWest Group and CRH were strong contributors. The portfolio also benefitted from a recovery in the materials sector and rotation away from more crowded areas of the market.
-
Equity long short manager Munro Global Growth detracted -1.7% for the September quarter. The fund’s long positions drove downside returns. Some of the larger detractors over the period included ASML, SK Hynix, Synopsys and Applied Materials. On the positive side some offsetting gains made in the long book included positions such as SharkNinja Inc and GE Vernova.
-