-
You can go
your own wayMajor economies appear to be going their separate ways – or rather, the US is going one way and the rest are going the other. Growth in the US continues to move onwards and upwards as the Biden Administration splash the cash. Europe is struggling to grow while China is at risk of becoming like Japan in the 1990s, stuck in a property crash and trapped by diminishing demographics.
In this increasingly protectionist, isolationist world, it is unlikely a strong US economy will be able to lift all boats. That means struggling economies will need to go their own way and investors will need to be more discerning about where to invest.
1. Biden’s America First (everyone else second) Policy
America’s manufacturing renaissance
President Biden has been described as more America first than former president Trump. His big spending programs include the Inflation Reduction Act (IRA), the Chips and Science Act and the Infrastructure Bill. Together, they amount to $US1.6 trillion in spending and incentives. So far, at least $US224 billion in cleantech and semiconductor manufacturing projects have been announced in the US since the passage of the IRA and the Chips Act.
The spending underscores the urgency the Biden administration feels around securing supplies of critical minerals (that are key to the energy transition), to re-shoring critical manufacturing, and to securing supply chains.
This big spending comes at a cost. The Biden Administration is the first in U.S. history to preside over a more than $1.7 trillion budget deficit. As a percentage of GDP, US public debt has more than doubled in the past 20 years. The US will spend more on debt interest this year than on defence.
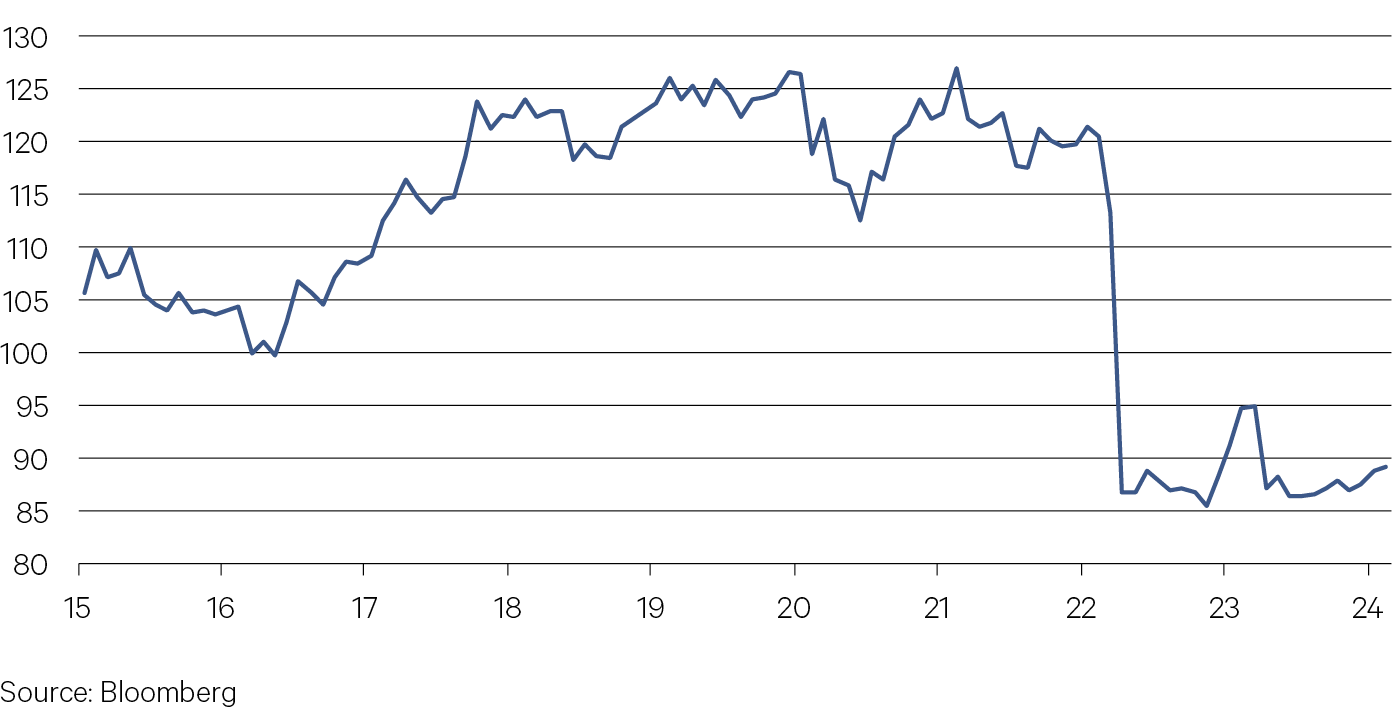
Chart 1: Public debt (latest, % GDP)

2. Europe – stuck in the middle
In real terms, Europe’s economy has grown by around half the pace of the US since 2019. The economy’s failure to expand in the fourth quarter of 2023 was due to a plunge in trade. This should be no surprise. Europe’s second largest trading partner outside of the Union is China. As Chart 2 shows, China’s imports of goods from its major trading partners is down 20% compared to last year.
China’s reluctance to buy from Europe comes at a time when European industry is suffering a double blow from high energy prices and, in contrast to the US, austere fiscal policy.
A third blow to Europe is President Xi’s focus on “new productive forces” in the economy. China is moving towards high-tech manufacturing. This will pose a competitive threat to Europe in the same way China’s production of electric vehicles has threatened its car industry.
Like the US, Europe’s own attempts to “de-risk” from China will be costly. Just as the effects of embracing China following its 2001 accession to the WTO were lower prices and greater trade, the effects of de-coupling will be higher prices and less trade. This will be a problem for Germany in particular, where 50% of its economy is export-oriented.
Chart 2: China’s buyers strike of foreign made goods

3. You go your way, I will go mine
China’s lost decade?
China is at risk of becoming like Japan in the 1990s. Property in China drives a fifth of GDP and is responsible for 70% of household wealth. A correction in property prices has had a significant impact on consumer spending.
The similarities to Japan extend beyond the crash in the property market. China is forecast to lose 20% of its workforce by 2050. China’s population is already shrinking. It declined by just over 2 million people in 2023. Older populations spend less and save more (particularly when there is little or no social safety net). This will weigh even more on consumer spending and confidence (see Chart 3).
Unlike previous downturns, China has avoided the use of large, debt-heavy, stimulus programs. Instead, President Xi wants to grow out of his problems by relying on what officials are calling “new productive forces”. This is the idea that new investment into disruptive breakthroughs will help fuel growth and productivity gains across the economy. It’s questionable how this new strategy will be any better than the “Made in China 2025” industrial policy. Especially with consumers in a weakened state. Who will buy this new productive output? China’s manufacturing trade surplus is already close to a record high and international relations are not great. China’s second-largest export market, Europe, is planning retroactive tariffs on the dumping of Chinese electric vehicles.
Chart 3: China’s consumers not very confident

-
Australian Equities

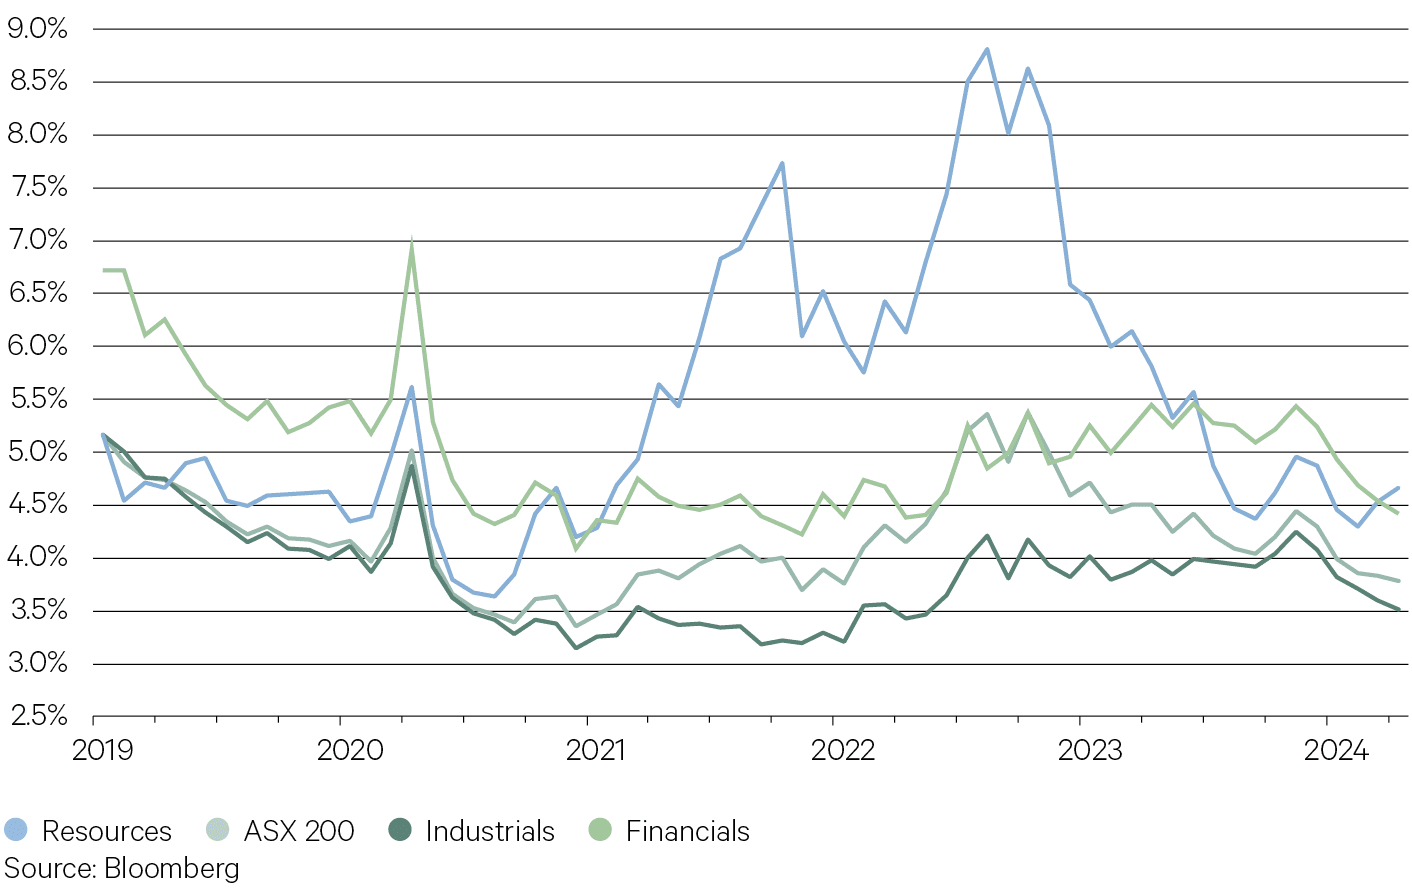
With strong share price appreciation over the last five months, the forward dividend yield on the ASX 200 has compressed, falling below 4%. All key sectors have experienced falling yields over the last 12–18 months, with the most notable being the volatile resources sector (where yields have almost halved) as dividends fell in line with commodity prices. Additionally, the financials sector, a key source of dividends for many domestic investors, has seen forward yields fall from 5.5% to under 4.5% in the current market rally.
Chart 4: ASX 200 Forward Dividend Yield:
Yields compressing across all key sectors
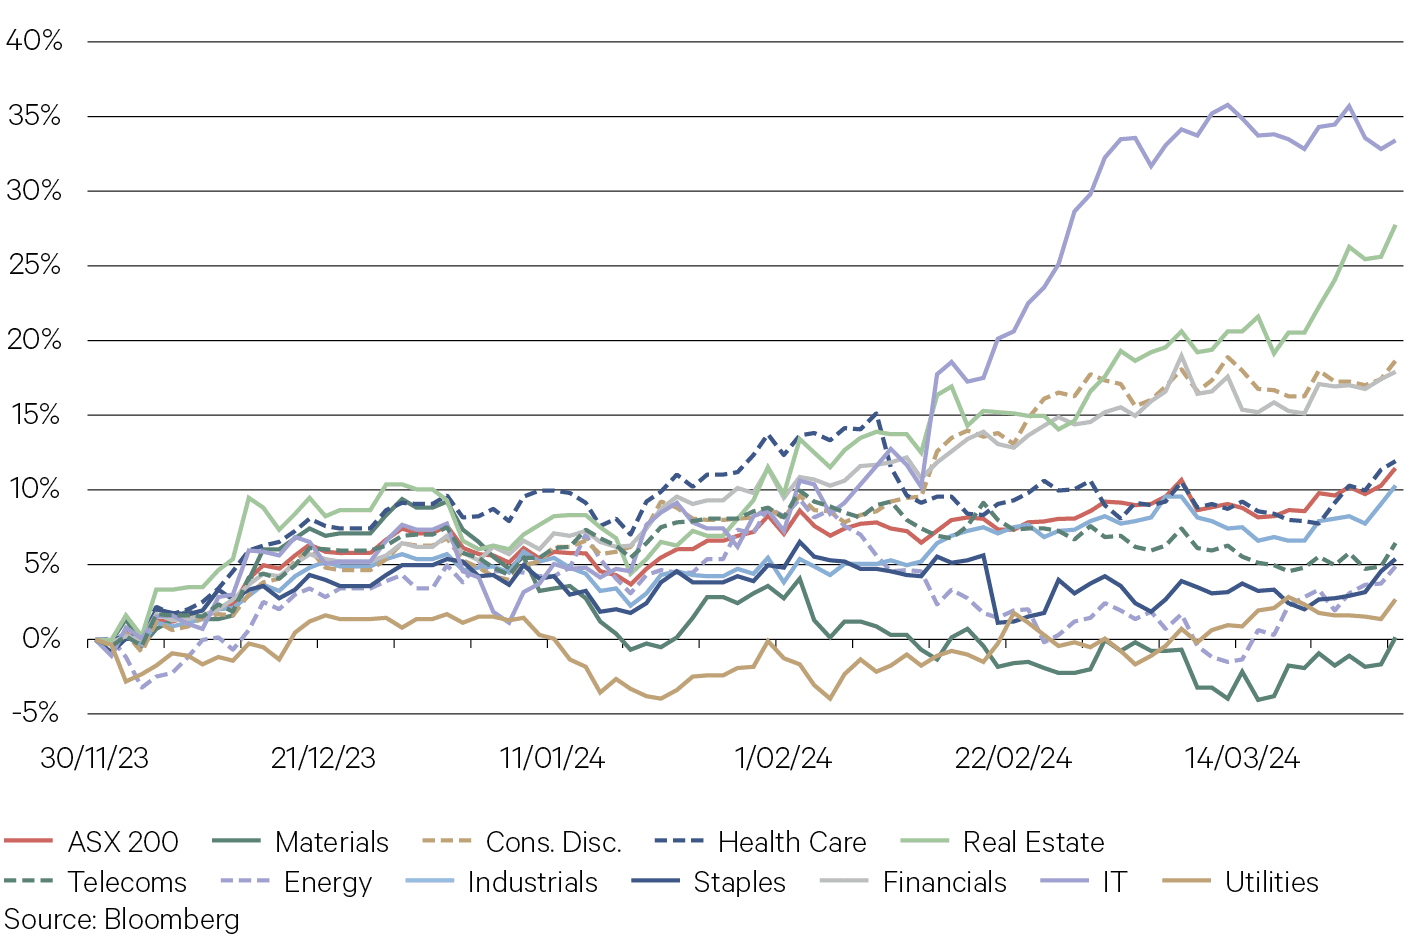
While the Australian equity market has lagged global equities over the last five months, the benchmark ASX 200 Index has still managed to post a double digit price return. All sectors are up, though there has been a clear difference between the winners and the laggards, with growth-orientated sectors such as IT and discretionary doing well, along with those more leveraged to the economy, such as financials. More defensive sectors have been left behind, including staples and telecoms, while materials have also suffered on iron ore weakness.
Chart 5: ASX 200 sector returns in current market rally


Key Points
- The Australian equity market generated a total return of 5.3% in the March quarter, building on a rally that commenced in November when investors began to anticipate the end of the monetary policy tightening cycle. Despite the solid returns, Australian equities lagged their international counterparts, which continued to advance on a ‘soft landing’ scenario playing out.
- There was wide dispersion in returns across the various sectors of the market. Growth-orientated stocks and sectors were among the best performers despite getting little assistance from long bond yields which were flat over the quarter.
- The IT sector, among the smallest in the market, headed the gains as it continued to rise in sync with the AI-driven thematic in the US. Other sectors to perform well included consumer discretionary and real estate.
- The key laggard was the mining sector (the only sector to lose ground in the quarter), which suffered as a number of commodities were weaker or remained under pressure, including iron ore, nickel and lithium. This led to weaker performance from key companies such as BHP and Rio Tinto.
- Australia’s half year reporting season was a key driver of individual stock performance in February. On aggregate, results were in line with expectations, though consumer discretionary stocks were among the top performers as results remained resilient in the face of a tighter monetary policy environment.
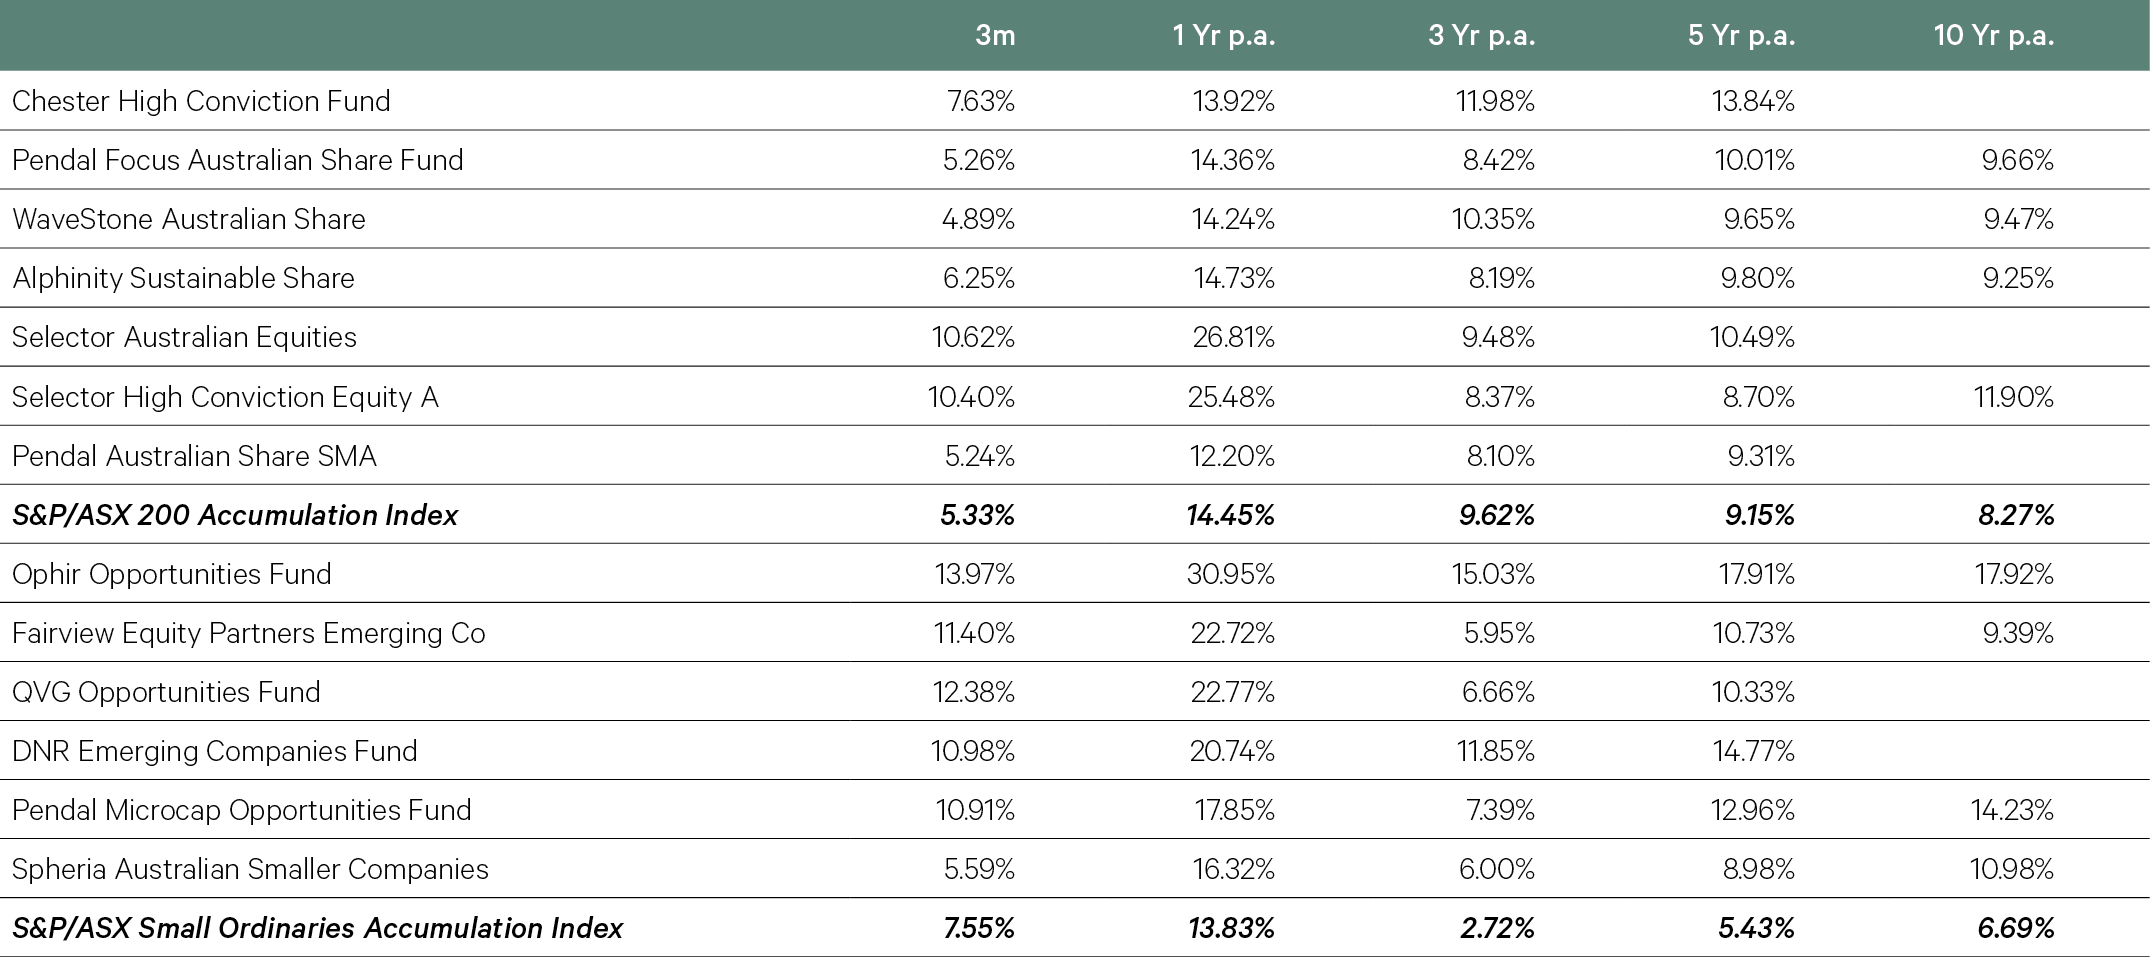
- Selector was the pick of our large cap managers and was aided by a larger overweight to the IT sector, which included its holding in Altium, which was the subject of a takeover bid in the quarter. The manager has now added over 12% alpha on a rolling 12 month basis.
- Chester was also a solid performer, which was a good result given the lack of high growth technology stocks in its portfolio. Themes such as healthcare, insurance and gold all contributed to the fund’s quarterly performance.
- Small caps managed to outperform large caps for the quarter by more than 2%, though have still lagged materially over the last three years.
- Pleasingly, our APL funds largely produced strong alpha above the index, with good stock-picking a feature across a range of managers, including QVG, Fairview, DNR and Pendal Microcaps.
-
International Equities

Price-earnings multiples for the next year appear much loftier than they seem given they are distorted by analysts’ conservative forecasts for earnings. The earnings recovery next year is expected to be relatively light. This slow recovery is making multiples appear a bit lofty. The S&P 500 has about half its stocks trading at a forward PE below their respective 2015–19 averages, and only four sectors, led by tech, have a majority of their stocks trading at a premium. The other three sectors are industrials, materials, and health care. In contrast, energy, communications, utilities, real estate and financials have the most companies trading below their 2015–2019 median.
Chart 6: US S&P500 Price-earnings ratio

The ratio of the Home Builders Index to S&P500 highlights the early cycle features the US economy is exhibiting at the moment. Despite aggressive rate hikes, the economy remains robust. There is considerable pent-up demand for homes where, like Australia, the market is undersupplied. There aren’t enough homes on the market to meet demand. Many homeowners are locked into their relatively low-rate 30-year fixed rate mortgages, resulting in a shortfall of resale homes. The U.S. is overall short 1.5 million housing units, the National Association of Home Builders said earlier this year.
Chart 7: Ratio of S&P Home Builders Index to S&P500. Early cycle?


Key points
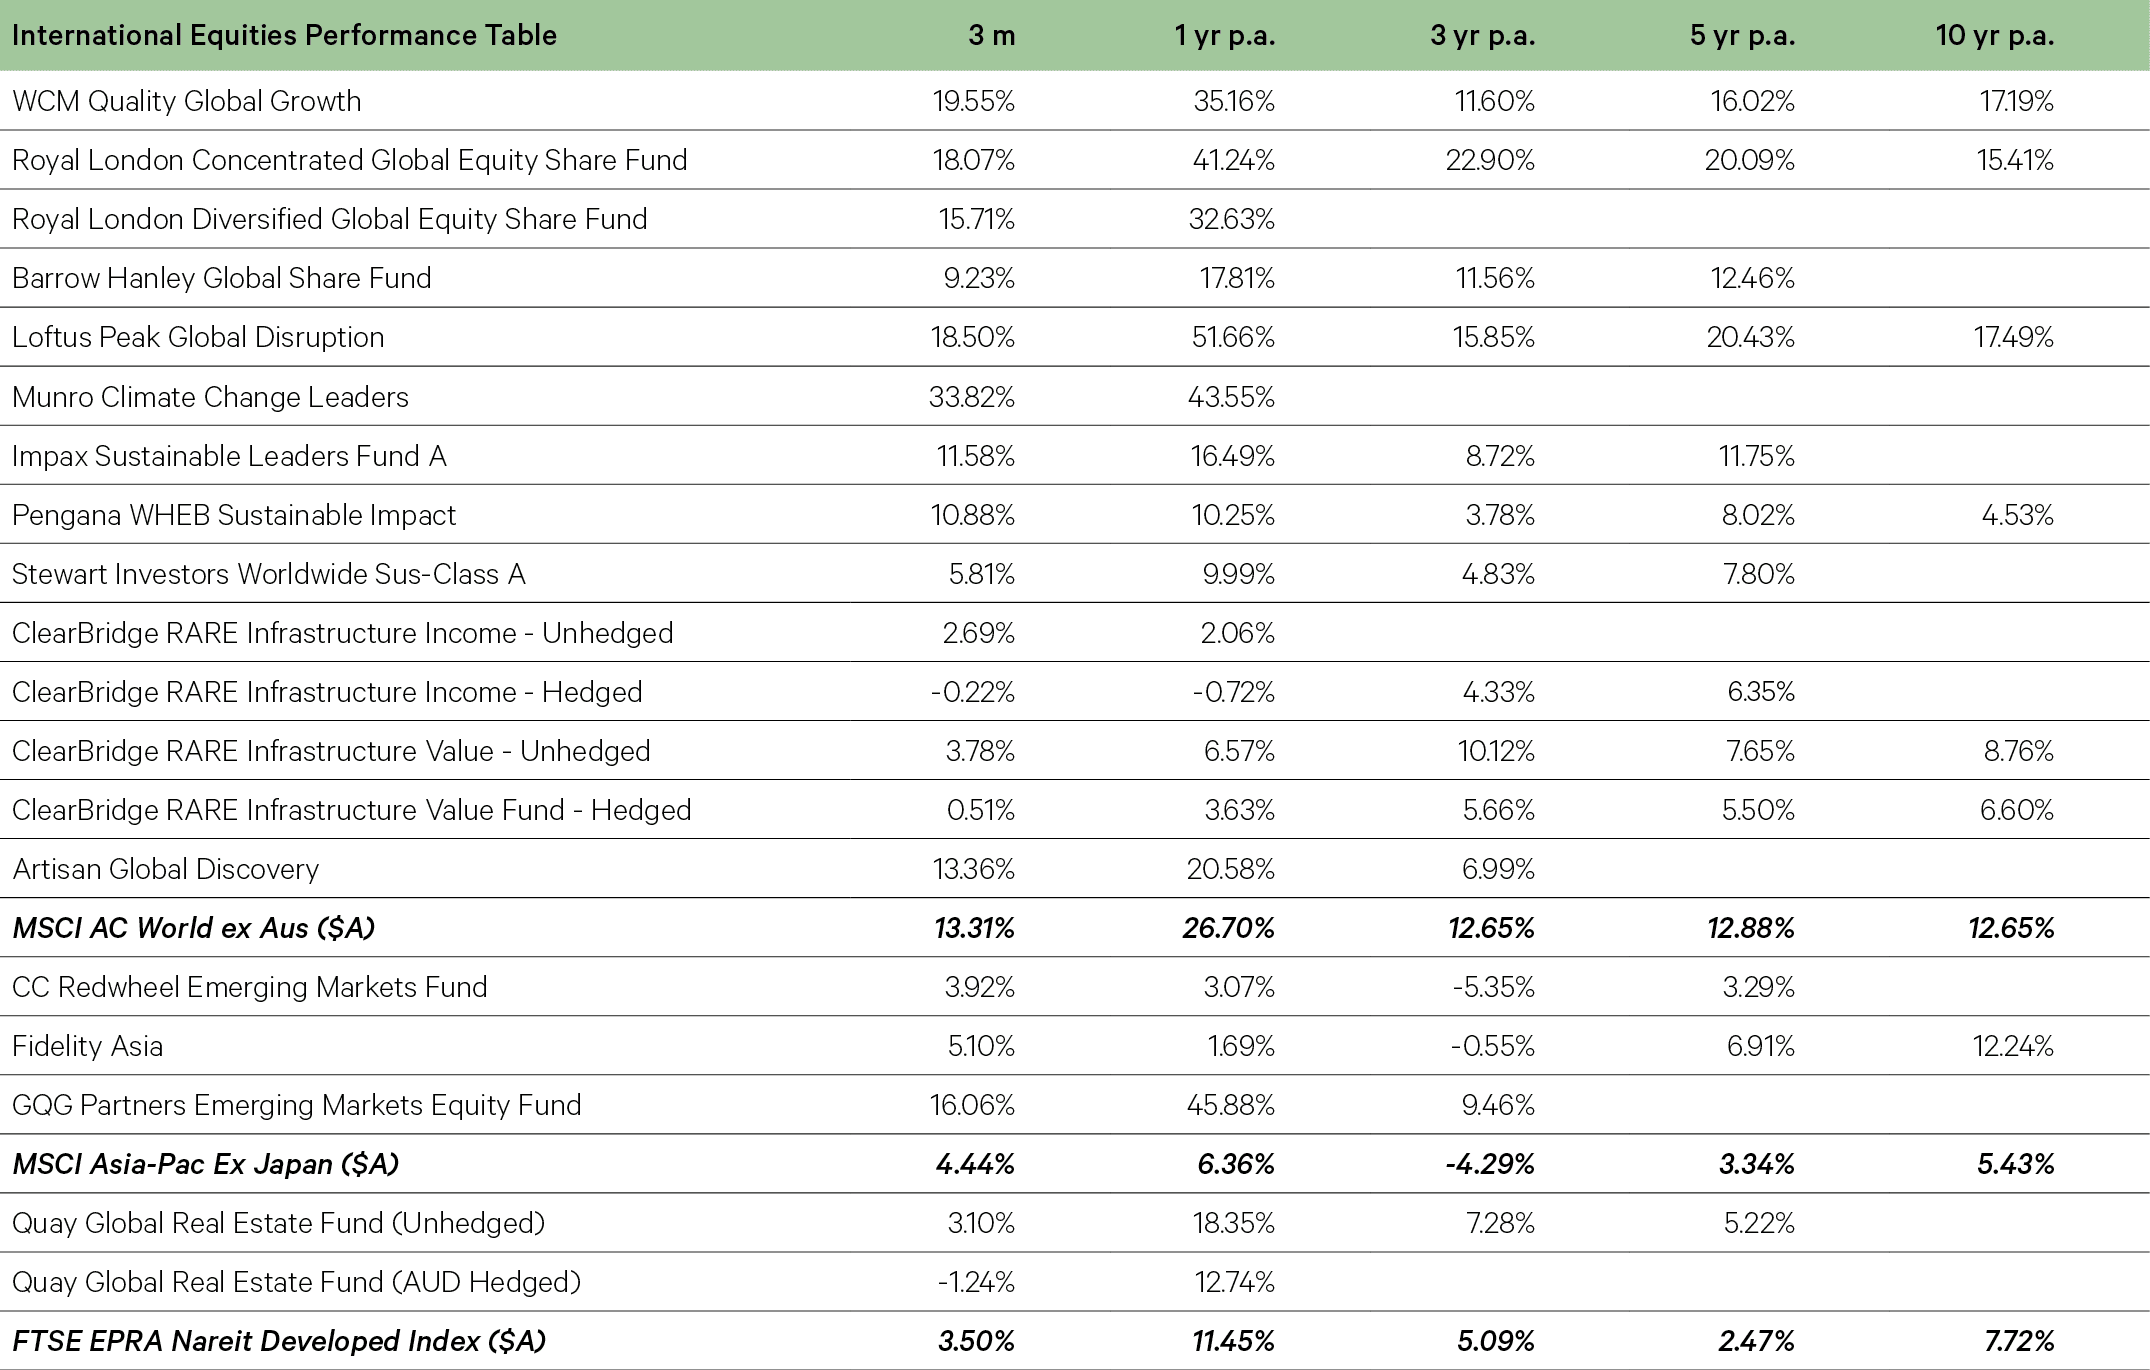
- The MSCI World Index rose by 8.5% in the quarter. The rise was led by Japan which rose by 20.6%. Europe also performed well with the eurostox up 12.4%. Italy was a standout in Europe rising by 14.5%.
- The S&P 500 index finished the quarter up by 10.2% while the Nasdaq rose 9.1%. Our tech disruption fund was a key beneficiary of this rising by 18.5% over the quarter.
- A standout performance came from the Munro Climate Leaders Fund which rose by 33.8% in the three months. This was driven by its holdings in Nvidia (+82.5%), ARM (+66.3%), Constellation Energy (+58.5%) and Comfort Systems (+54.6%).
- Every sector was positive. Energy (helped by a 15% rise in oil prices), information tech and financials were the leadings while utilities and consumer discretionary bought up the rear.
- Emerging market (EM) equities were up a more subdued rising by 1.9%. Weighing on the index was flat to slightly negative performances for Brazil, Thailand and Singapore. While the overweight to India and underweight to China helped our GQG Emerging Market Fund, performance in the quarter was more driven by its holding in Nvidia.
- The Australian dollar fell 4.3% against the US dollar and to a lesser extent against the euro and British pound. Global funds that were currency unhedged therefore benefited.
- While bond yields rose over the quarter, our more growth-oriented funds such as Stewart Investors remained resilient.
-
Fixed Income

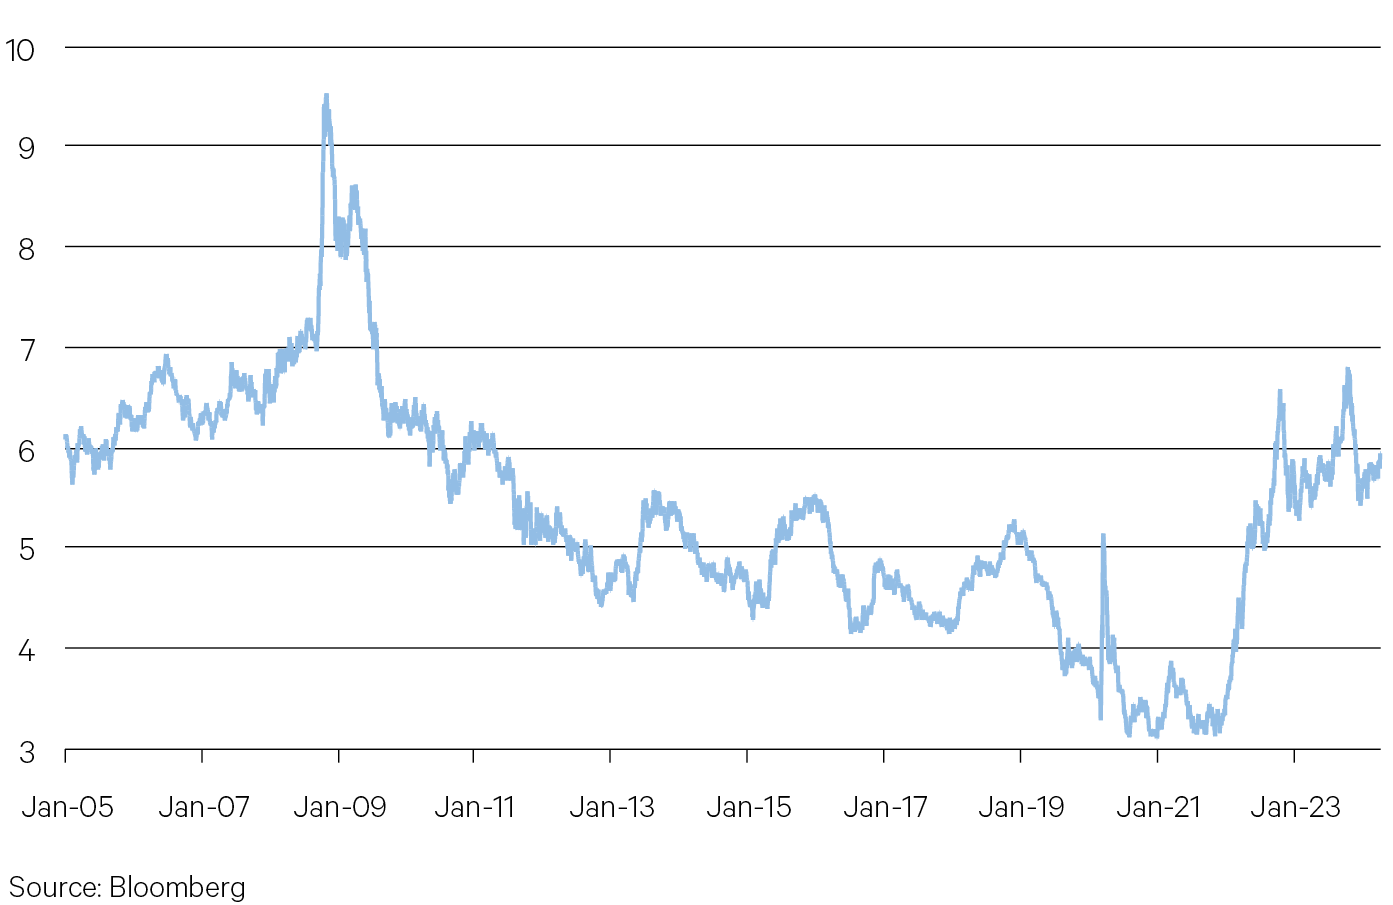
Borrowing costs for US corporates took a step up after the March inflation report. Bond yields across the board rose. Borrowing costs for high grade US corporates remain elevated at around 6%.
This doesn’t necessarily translate into immediate pain for companies. For S&P500 companies, 92% of their debt is fixed rate. Helping the maturity profile in coming years is the fact that many corporates have termed out their debt. This means corporate balance sheets in the US remain in relatively healthy shape despite the higher interest rate environment.
Chart 8: Borrowing costs for US corporates (yield for Baa rated corporates, %)

US inflation has dug in, rising 3.5% in March from a year ago – the most since September. That’s confounded expectations of a near term cut in interest rates resulting in a rise in bond yields.
The bigger-than-expected bump in consumer prices was largely due to higher housing and petrol prices. Americans also saw higher prices for clothing, car insurance and repair and domestic services like house cleaning, exacerbating what’s long been a steep climb in the cost of living.
Chart 9: Inflation confounds the rate cut camp


Key points
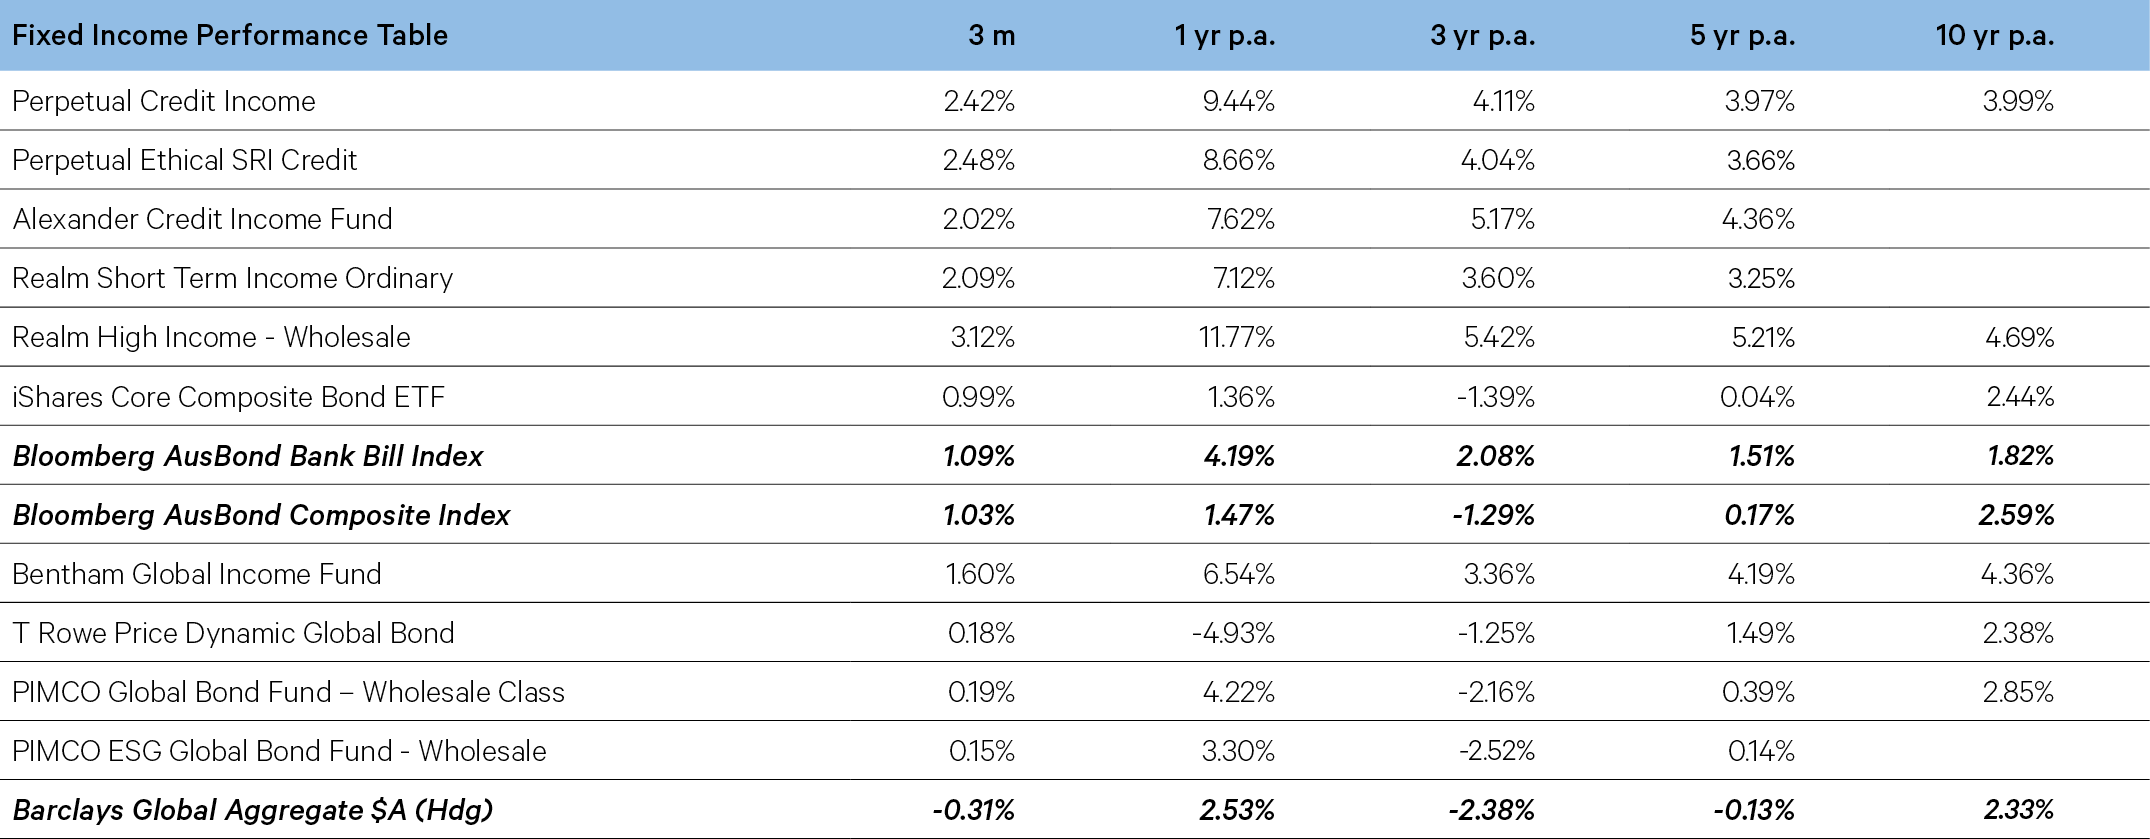
- Government bond yields rose in the quarter, in particular in January and February. This reflected markets pricing in the probability of a no-landing/ soft-landing for the US economy on the back of better-than-expected economic data. Credit spreads widened in general.
- Overall, 10-year government bond yields in Australia were largely unchanged after the increase in yields in January and February were offset by a decline in March. In the US, yields were up 34 basis points in the quarter. Both the Reserve Bank of Australia and the US Federal Reserve opted to leave official interest rates unchanged at 4.35% and 5.5% respectively. The Swiss National Bank was the first of the major economies to cut interest rates while the Bank of Japan lifted interest rates for the first time in 17 years.
- The rise in yields was a hinderance for investment grade credit where duration risk is higher. This particularly was an issue for our PIMCO Global Credit Fund. Higher yields benefited our floating rate credit and liquidity funds such as the Perpetual Credit Income and Alexander Credit Income funds and the Realm High Income and Short-term Income funds.
- Government bond yields rose in the quarter, in particular in January and February. This reflected markets pricing in the probability of a no-landing/ soft-landing for the US economy on the back of better-than-expected economic data. Credit spreads widened in general.
-
Alternatives

US PE dealmaking finished last year down circa 41% from the all-time peak of $1.2 trillion set in 2021. US PE deal flow has started to show some signs of stabilising in the past several quarters. In Q1 2024, deal activity continued to move mostly sideways with estimated deal count slightly elevated relative to the past four quarters and deal value moderately lower. Platform leverage buyout deals (LBO) deals continue to be scarce due to their greater dependency on leverage. Leverage ratios continue to reflect tight conditions, and this is choking the ability to pull off larger LBOs, which platform deals tend to be.
Chart 10: US PE Deal Activity

Private debt total assets under management (AUM) hit $1.9 trillion in 2023 as higher base rates and stable spreads continues to attract institutional and individual investors to the asset class. Private debt has now overtaken venture capital (VC) as the second largest fundraising area within private markets more broadly. Returns for the asset class were at their highest for many strategies since the global financial crisis as credit spreads above base rates remained stable over the year providing investors with strong total returns for the year. With the outlook for central bank policy rates likely to remain higher for longer more investors are likely to continue allocating to private credit going forward.
Chart 11: Private Debt AUM


Key points
Hedge Funds
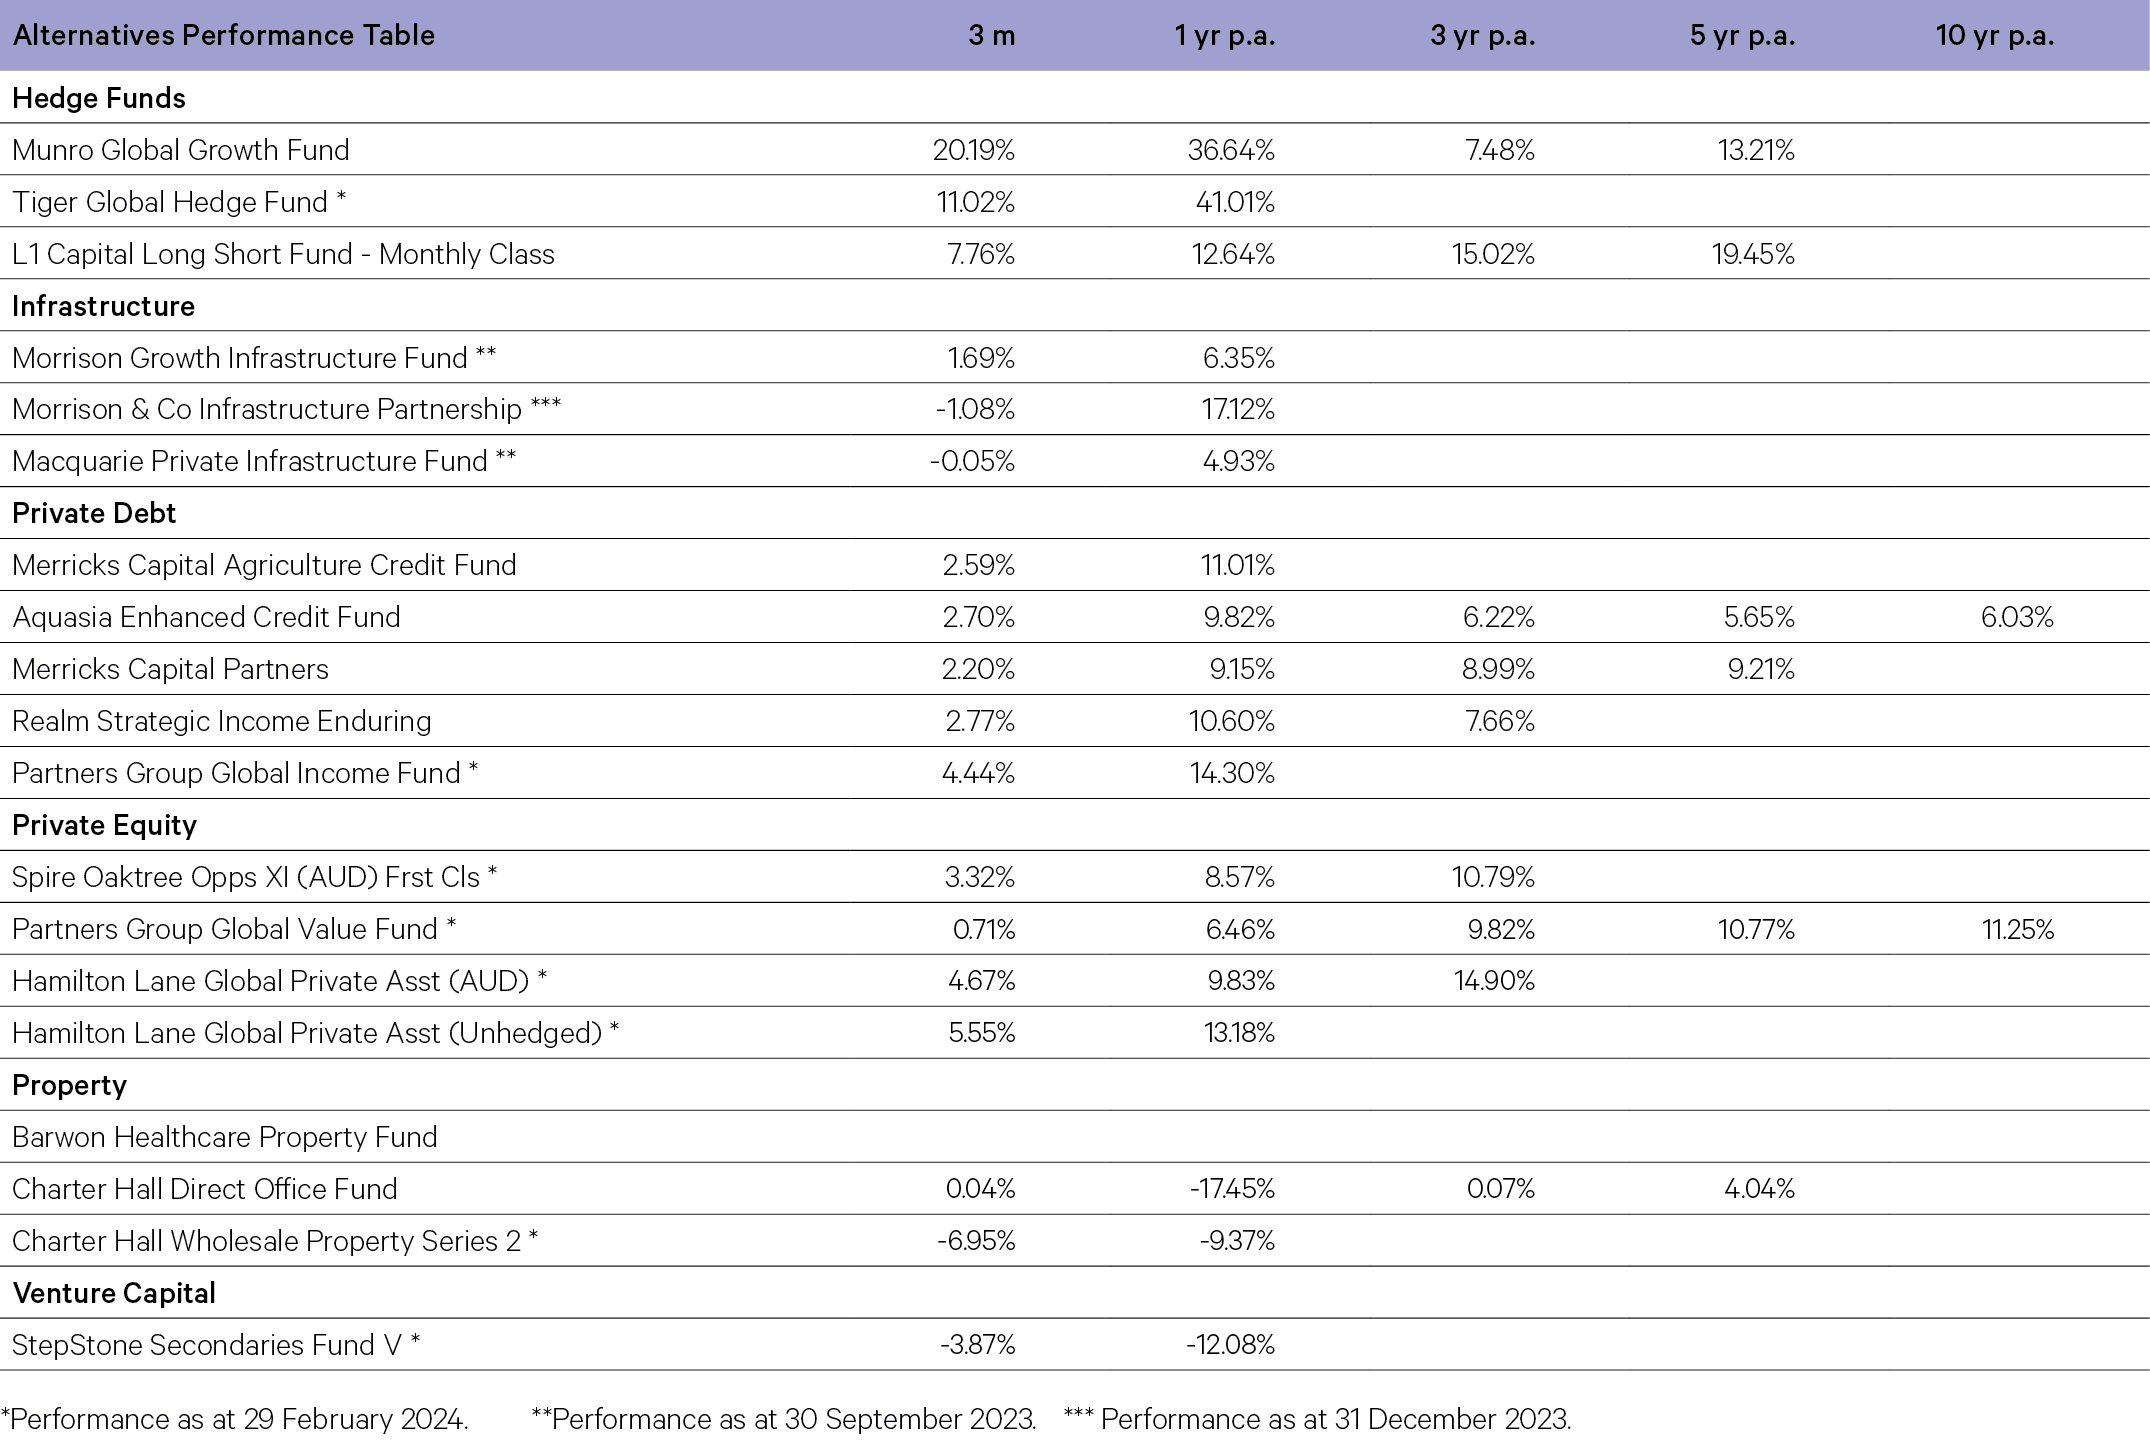
- Equity long short manager Munro Global Growth added 20.2% over the March quarter. The Fund’s long positions drove the quarterly performance with a position in Nvidia being one of the key contributors to performance. The company’s Q4 result highlighted continued growth in demand for its accelerated computing solutions because of the emergence of generative AI. Other long positions including Constellation Energy, Meta and Amazon were also key contributors.
- Equity long short manager L1 Capital Long Short finished the quarter 7.7% against the backdrop of a volatile market environment. During the quarter, the portfolio was well positioned to benefit from the tailwinds in the copper, energy and gold markets.
- Tiger Global benefited from core long positions across a large range of names. Within the internet sector long positions in Meta, Google and Amazon contributed strong returns over the quarter whilst in the software sector exposure to Microsoft was additive to returns. Positions in Elli Lily and Nvidia were also notable contributors over the quarter. Outside of the ecommerce and fintech space, a position in Apollo Global Management contributed strong returns. Overall, the manager continues to maintain a conservative level of exposure.
Private Equity
- Private equity (PE) M&A and IPO activity remains below average over the first quarter of 2024 however there have been some signs of activity picking up toward the end of the quarter as investors see less volatility in interest rate markets helping to provide more certainty in pricing. The quarter finished with the fourth-largest PE exit ever while there were also some notable IPOs with US IPO values for Q1 up 21% vs the same period a year earlier.
- For the three-month period ending February 2024, our PE fund managers had positive returns as Hamilton Lane Global Private Assets Fund added 4.7% and Partners Group Global Value added 0.7%. To the end of February 2024 the funds had one-year returns of 9.8% and 6.5% respectively. Hamilton Lane had positive attribution from secondary positions acquired during the quarter at discounts ranging from 10–20% and some realisations of secondary positions across consulting businesses. Partners Group also had positive attribution during the quarter from secondary positions acquired as well as positive results for healthcare and consumer discretionary positions in the portfolio.
Private Debt
- Merrick’s Partners added 2.2% over the three months ending March 2024. Underlying loan income performed strongly across the quarter, with floating rate loans continuing to pass through rising interest rates in Australia and New Zealand. The portfolio currently comprises senior secured loans diversified across fourteen sub-sectors and is additionally diversified by geographic spread and borrowers. Credit default Swap (CDS) protection continues to provide the Fund with a cost-effective macro credit hedge.
Infrastructure
- The Macquarie Private Infrastructure Fund was flat over the December quarter. While in local currency terms all underlying Unlisted Infrastructure Funds had a positive return, these gains were offset by unfavourable USD and EUR currency movements in relation to these holdings. The Fund’s Listed Infrastructure holdings made a positive contribution to performance. The fund continues to benefit from longer-term structural trends in the sector. Significant opportunities continue to open up for investment into next generation infrastructure such as renewable energy and digitisation.
Property
- Direct property funds contracted in the first quarter, revaluations across many of the subsectors continue to price in softer demand with lower transaction volumes key to this. However, rental growth across some portfolios recently is starting to counter softer capitalisation rates. For the first quarter, Barwon Healthcare Property Fund finished down 2.1% whilst the Charter Hall Direct Office Fund was flat.


