-
Q3 in review –
Repricing a more resilient world
Financial markets spent much of the quarter adjusting to a world that looks increasingly different from the past decade. Artificial intelligence continues to drive corporate investment and earnings expectations, while economic resilience has challenged the outlook for monetary policy.
The result has been a reappraisal across asset classes: companies positioned to benefit from the AI investment cycle have continued to attract investor interest, bond markets have demanded higher compensation for long-term lending, and currency markets have reacted sharply to changing expectations for monetary policy. Although these developments appear distinct, they reflect a common theme: investors are increasingly positioning for a world of stronger investment, firmer growth, and structurally higher real interest rates.
1. AI front and centre
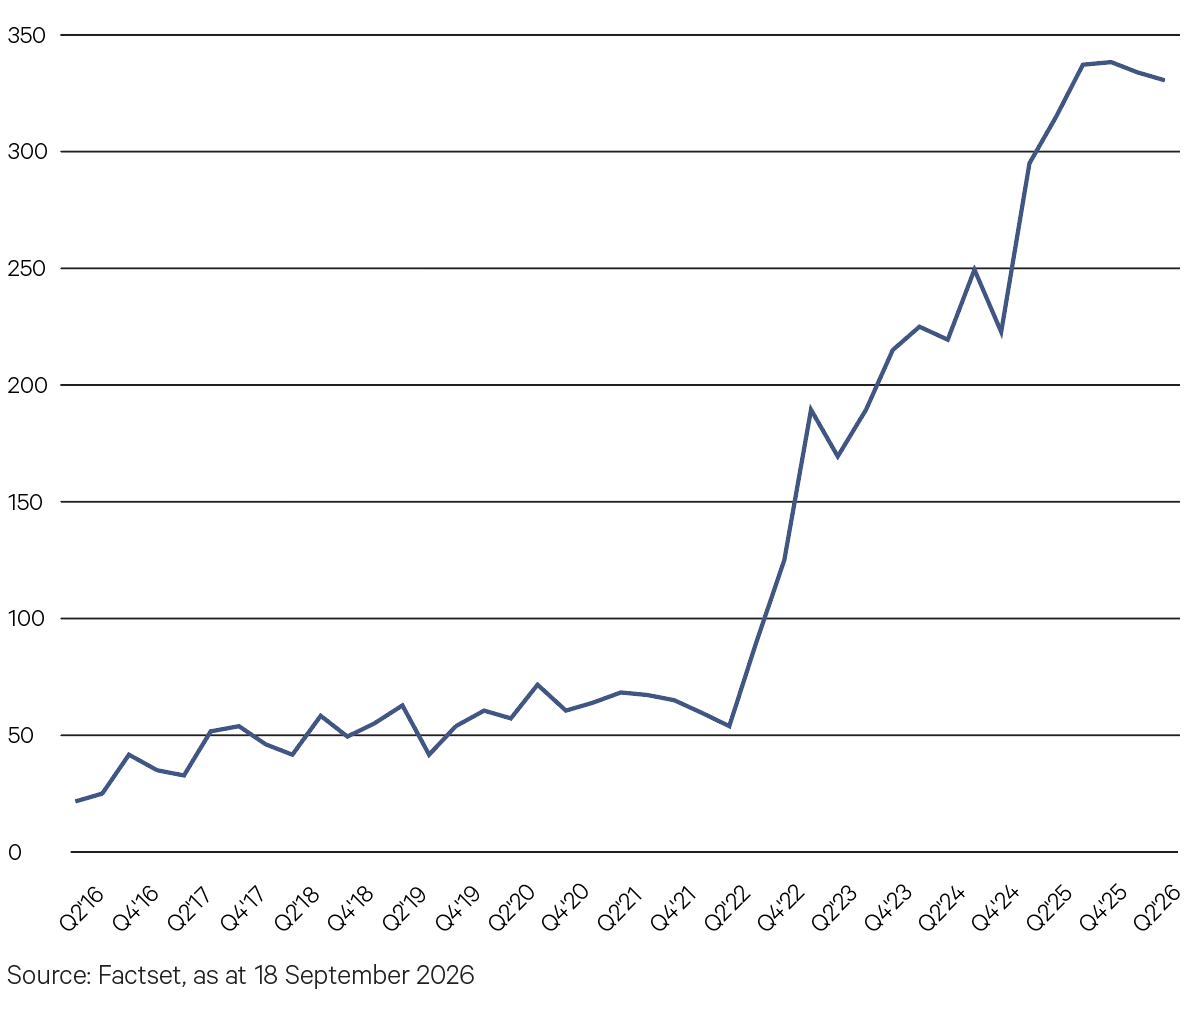
Artificial intelligence continues to exert a significant influence on both corporate strategy and investor sentiment. More than two-thirds of S&P 500 companies referenced AI during their Q2 earnings calls, a dramatic increase from the 50-70 companies that typically discussed AI in the years preceding ChatGPT. While enthusiasm remains elevated, the market’s focus on AI is not purely thematic. Companies mentioning AI have outperformed their peers by 7.6% this year, reflecting investor expectations that AI adoption will drive faster earnings growth, productivity improvements, or participation in the ongoing AI infrastructure build-out.
Chart 1: Number of S&P 500 earnings calls mentioning AI

2. AUD’s round trip
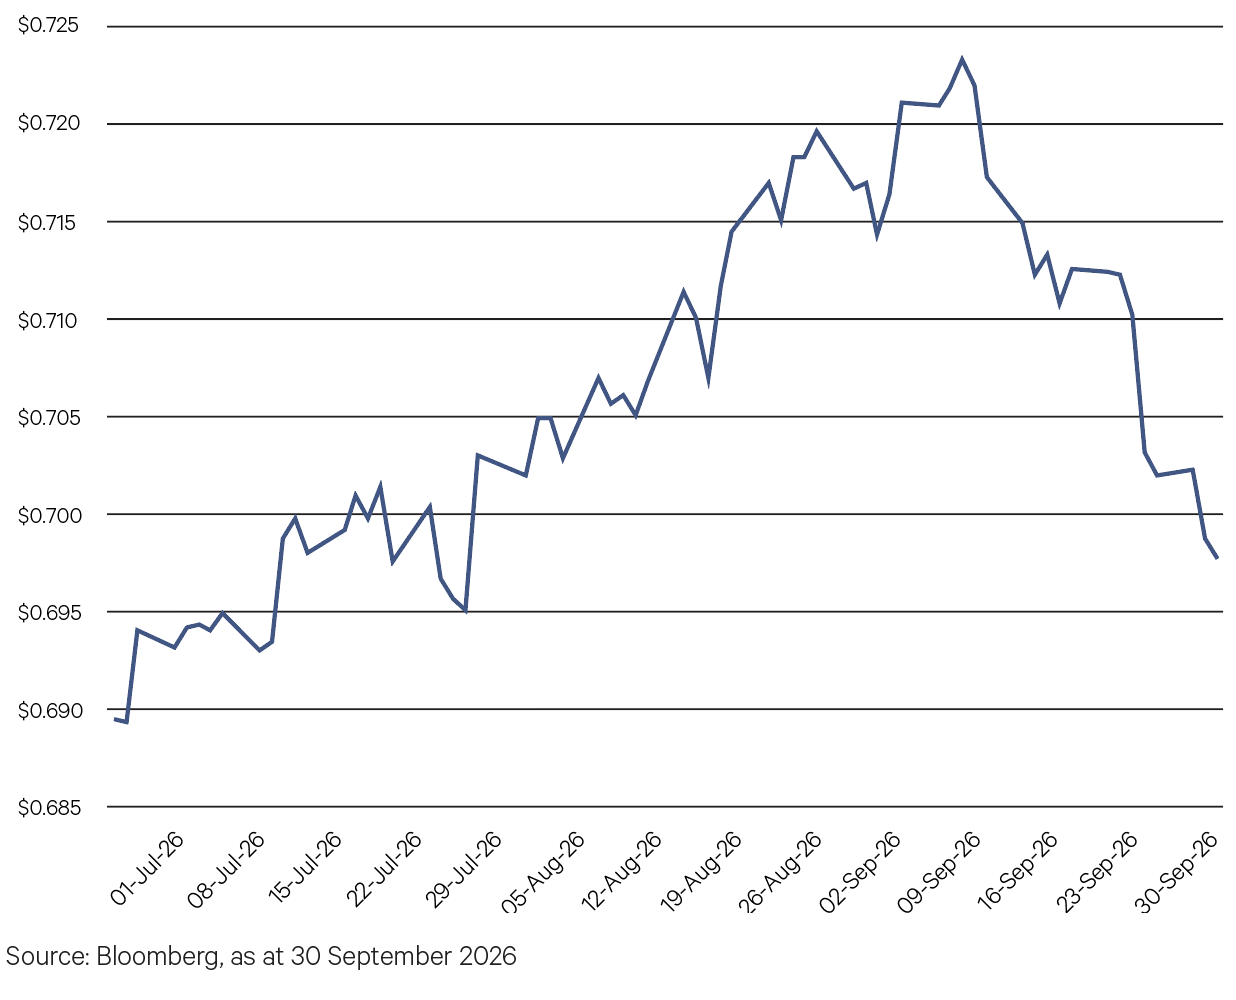
Foreign exchange markets were largely driven by changing expectations for monetary policy during the quarter. The Australian dollar rallied through most of July and August as markets positioned for Federal Reserve easing, before reversing sharply in September as stronger US economic data and higher Treasury yields challenged that view. The move reinforced the US dollar’s role as both a yield and safe-haven currency, particularly as risk appetite softened late in the quarter. For Australian investors, the September reversal provided a tailwind to unhedged international exposures, although the overall impact of currency positioning was limited given the Australian dollar finished the quarter only marginally above its starting level.
Chart 2: AUD/USD exchange rate over September quarter

3. Higher for longer
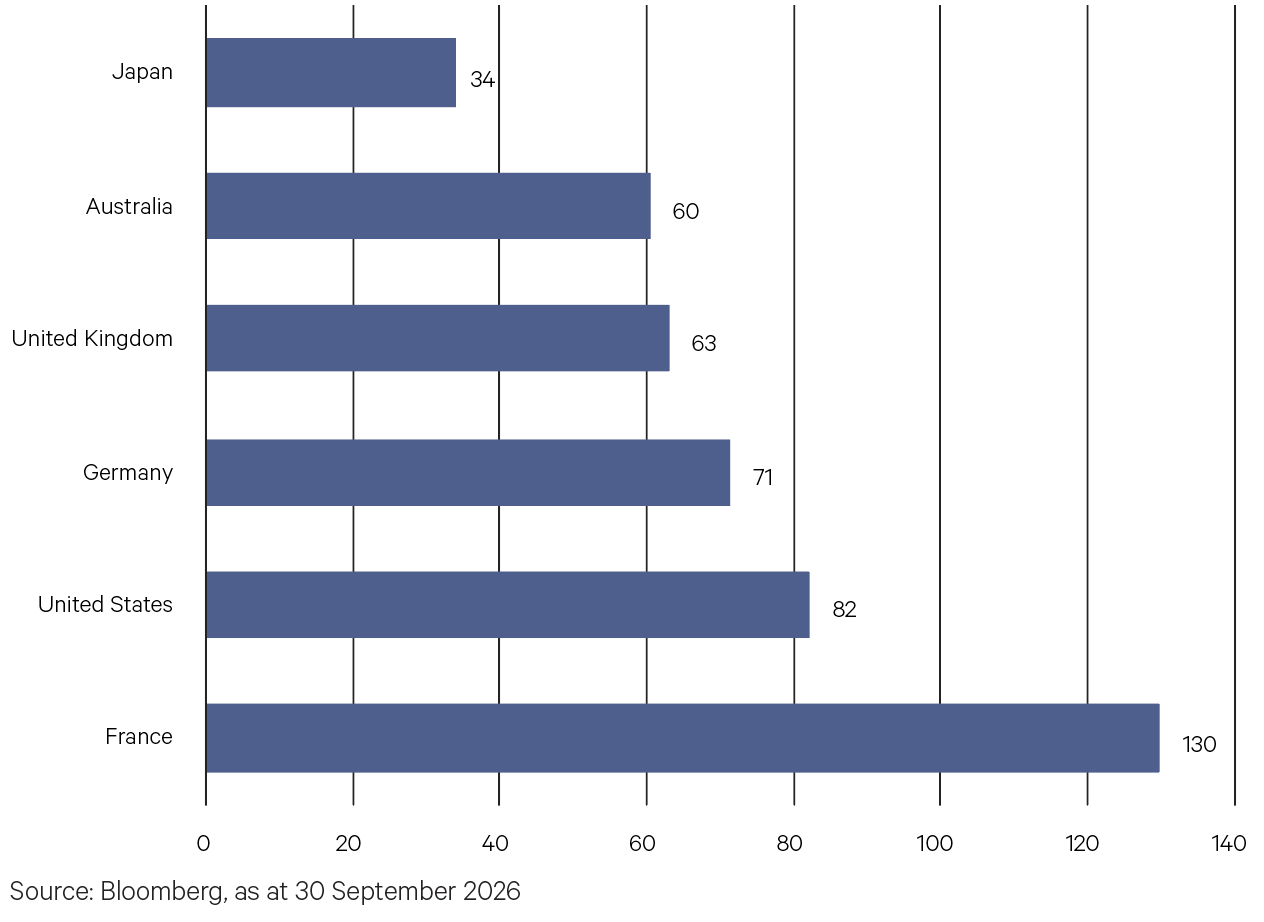
The rise in government bond yields remained a defining market theme during the quarter, particularly at the long end of yield curves. For the first time since 2007, the average G7 10-year yield moved above 4%, reflecting a shift away from the low-rate environment that characterised much of the post-GFC period. Higher yields were driven predominantly by rising real rates, signalling growing confidence in economic resilience, while investors also demanded a larger term premium to compensate for growing government debt burdens and substantial capital requirements linked to the AI build-out. Although yields rose broadly across developed markets, France stood apart as political uncertainty and concerns around fiscal sustainability drove a sharp increase in sovereign risk premia.
Chart 3: Q3 change in benchmark 10-year yields (bps)

-
Australian Equities

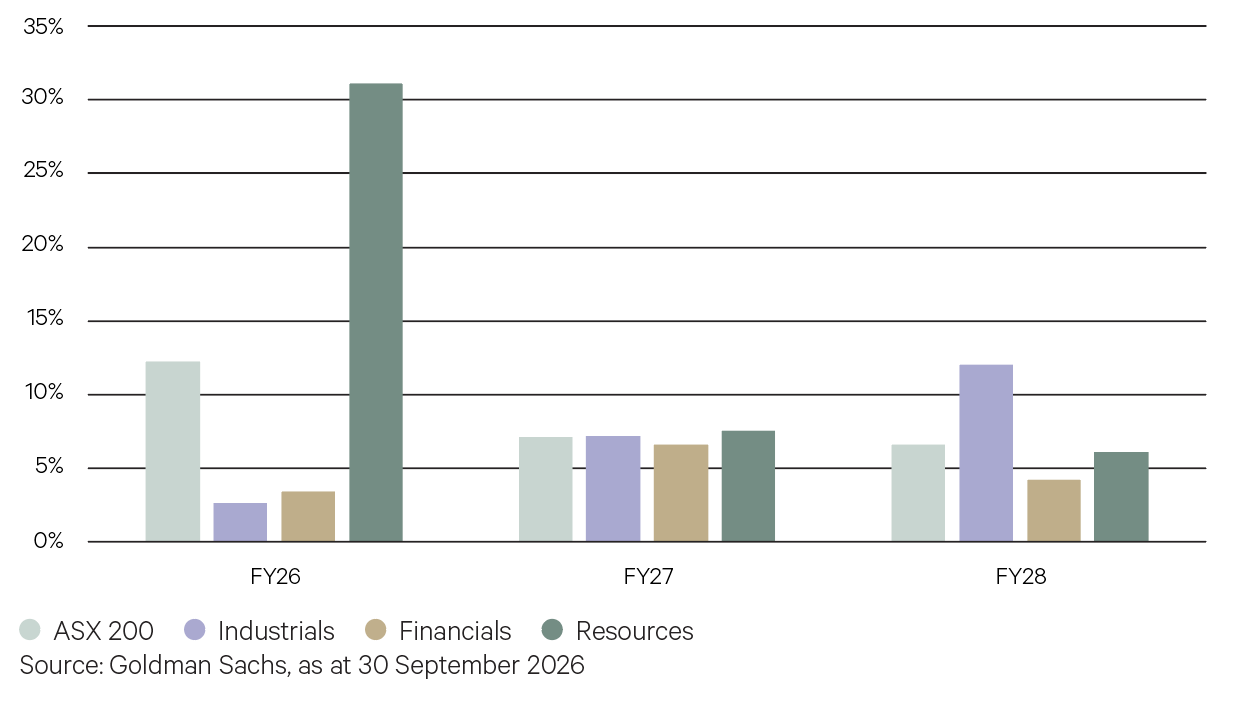
The Australian equity market delivered 12% earnings growth in the 2026 financial year, which was broadly in line with expectations leading into August’s results season. The bulk of this, however, was driven by a rebound across the volatile resources sector, where earnings expanded by more than 30%. The next two years are expected to deliver more modest but balanced growth across the market’s key sectors. However, the domestic outlook has become increasingly vulnerable to persistent inflation and the prospect of further monetary policy tightening.
Chart 4: Balanced but slowing earnings growth forecast ahead for the Australian market

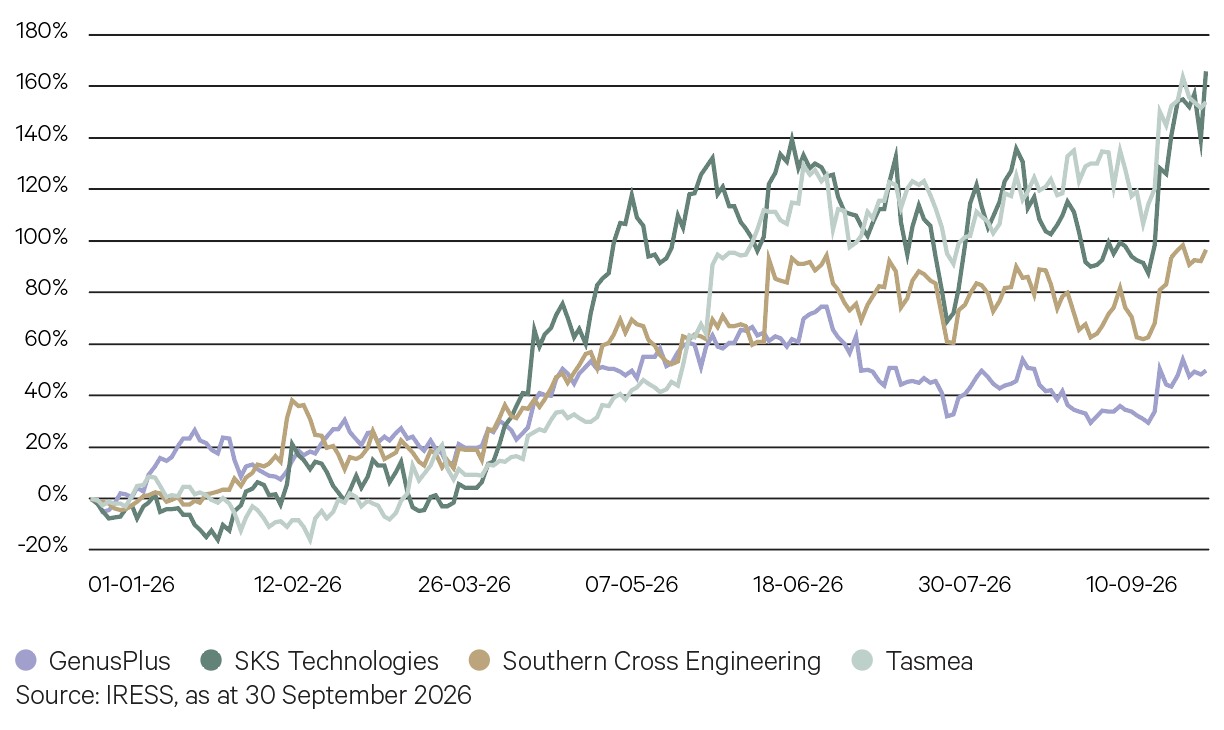
The Australian equity market’s limited exposure to the AI ecosystem has been a key reason for its underperformance relative to global equities in the last few years, despite the healthy returns that have been generated in the resources sector more recently. Smaller contracting companies, however, have been among the big winners in the market over the course of 2026, as revenues, margins, and order books swell on a rise in activity driven by the rollout of data centres in Australia.
Chart 5: Data centre contractors the ASX winners year to date


Key Points
- The Australian equity market was flat over the September quarter, as gains over the first several weeks of the financial year preceded rising headwinds and weaker markets into the end of the quarter. Our market slightly underperformed global equities for the three months.
- At a company level, August’s reporting season was a key driver of equity performance. While results were broadly in line with expectations, forward earnings for the market were downgraded over the course of the month, indicating cuts from weaker company guidance and a more cautious near-term outlook which has been compounded by various macroeconomic factors.
- These macroeconomic developments were also a clear headwind for Australian equities over the quarter. Australian bond yields rose in unison with global bond yields as markets priced in broad tightening of monetary policy in the months ahead.
- Australia’s domestic inflationary problem was exacerbated by a rebound in the oil price, leading to a fourth hike this year by the RBA in September. Meanwhile, the domestic housing market experienced further weakness, adding to the negative sentiment and decline in activity following May’s federal budget and associated tax changes.
- Sector returns again showed a high level of dispersion. Healthcare was a big winner, particularly through August’s reporting season, with stocks rebounding after companies reported in line with expectations, breaking a recent trend of downgrades. Energy was similarly strong, buoyed by the rising oil price as the conflict in Iran dragged on without resolution, while gold equities bounced back after weakening over prior months.
- Real Estate was a key laggard for the quarter, with rising bond yields a headwind for performance. Consumer Discretionary was the other sector that came under pressure as a softer outlook for discretionary spend was anticipated amid a squeeze on household budgets.
- With this backdrop, resources outperformed industrials over the quarter, and small caps lagged their safer large cap counterparts.
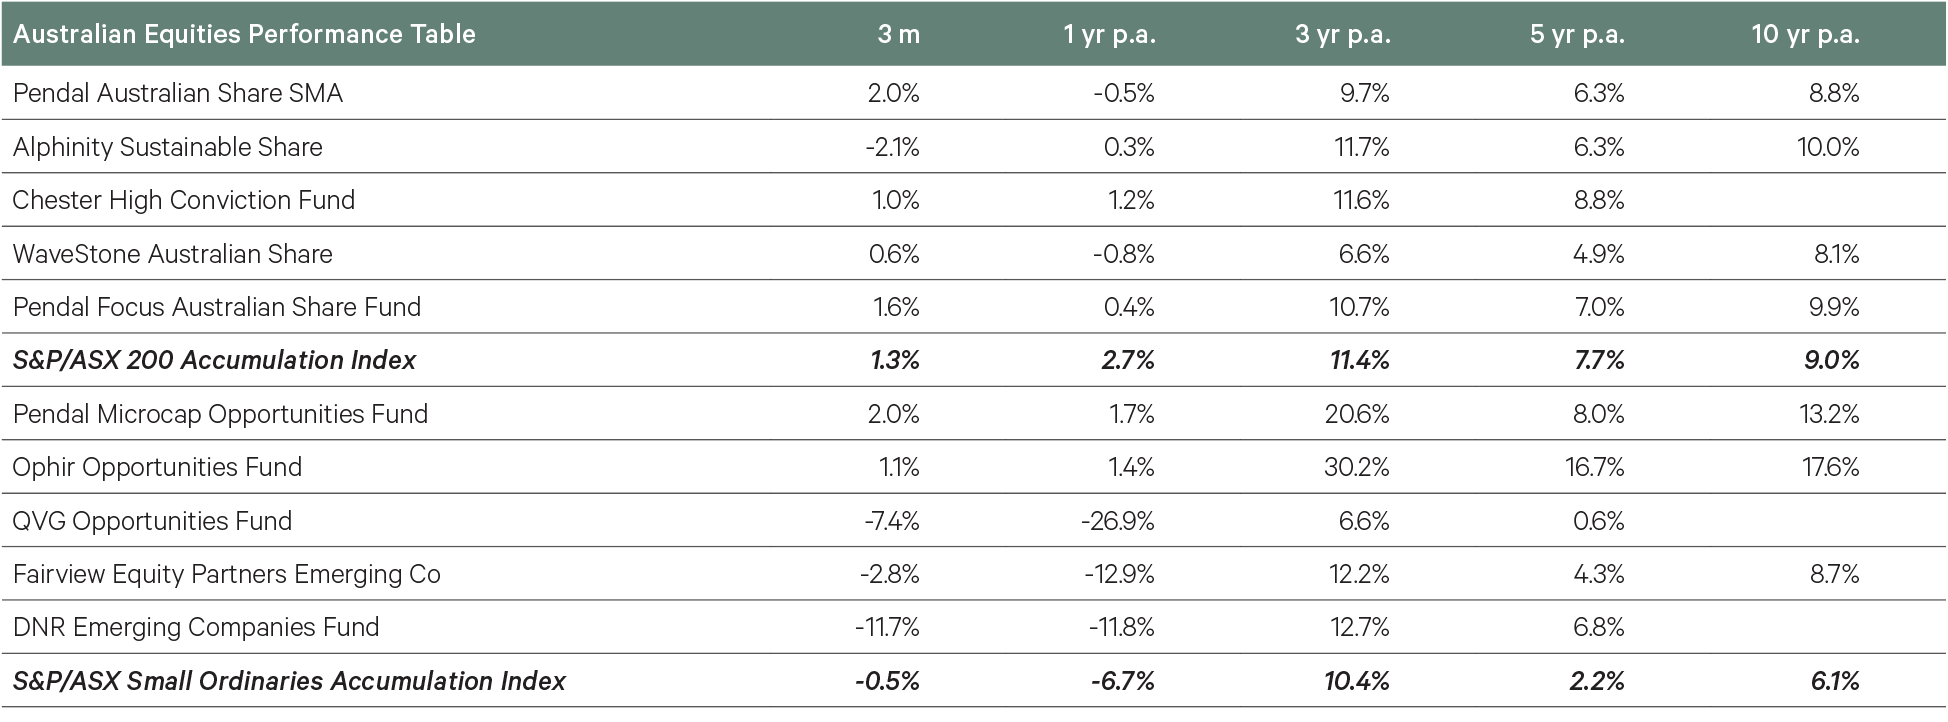
- Among our large-cap strategies, Pendal was the best performer, with the portfolio delivering solid outperformance in August, driven by a range of industrials and resources companies that reported results that were well received by investors. Chester similarly had a positive reporting season and was supported by a strong rebound in gold equities over the course of the month.
- Small caps have underperformed large caps since the onset of the Iran war and this continued in the September quarter amid a more challenging domestic demand environment, leading to variable fund performance. DNR, which had previously outperformed significantly on a rotation into resources, gave back some of this alpha amid a step up in volatility across lithium, rare earths, and base metals miners. QVG’s tilt towards longer duration growth companies was hurt by the sharp rise in long bond yields.
- Pendal Microcap Opportunities was the best performer of our small-cap funds, with performance driven by a diverse range of industrial stocks coupled with an underweight to the resources sector.
-
International Equities
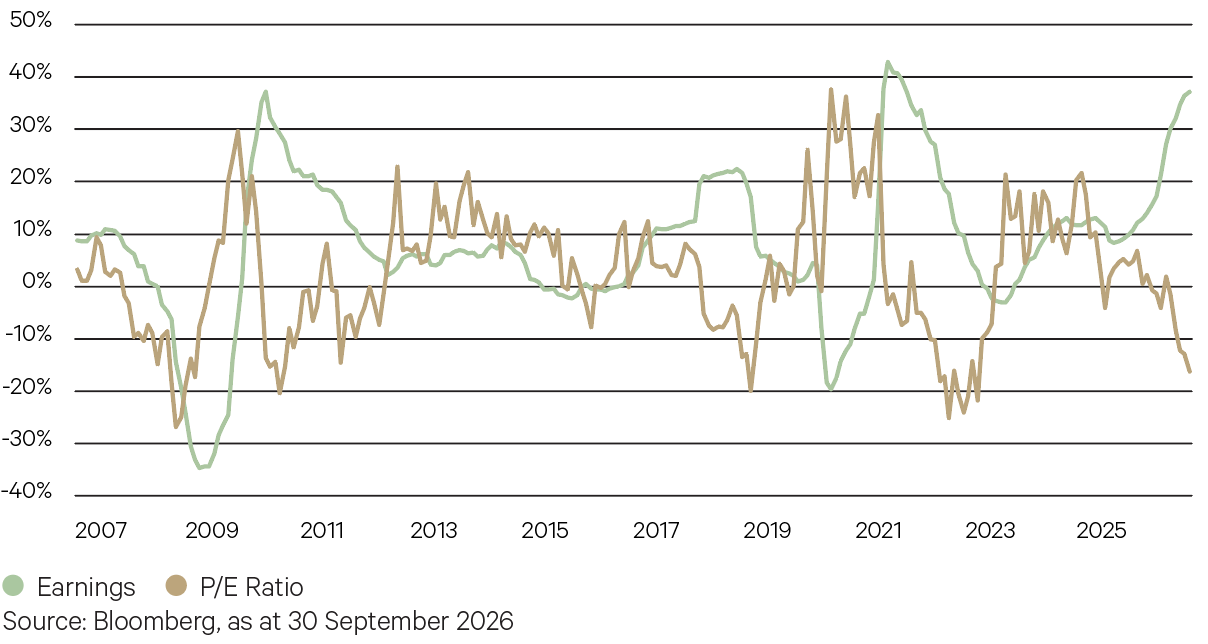
Rarely has the change in earnings and valuations diverged so much in the US equity market. On a rolling 12-month basis, earnings growth has surged in US equities by close to 40%, underpinned by the investment in the AI ecosystem. Over the past 30 years, earnings upgrades of this magnitude have occurred on only two other occasions: during the recoveries from the Global Financial Crisis and the pandemic. At the same time, P/E ratios have derated close to 20% over the twelve months, creating a headwind for equity returns, with rising bond yields a key factor in this development.
Chart 6: S&P 500 earnings surge as valuations contract – Rolling 12m change in earnings and P/E

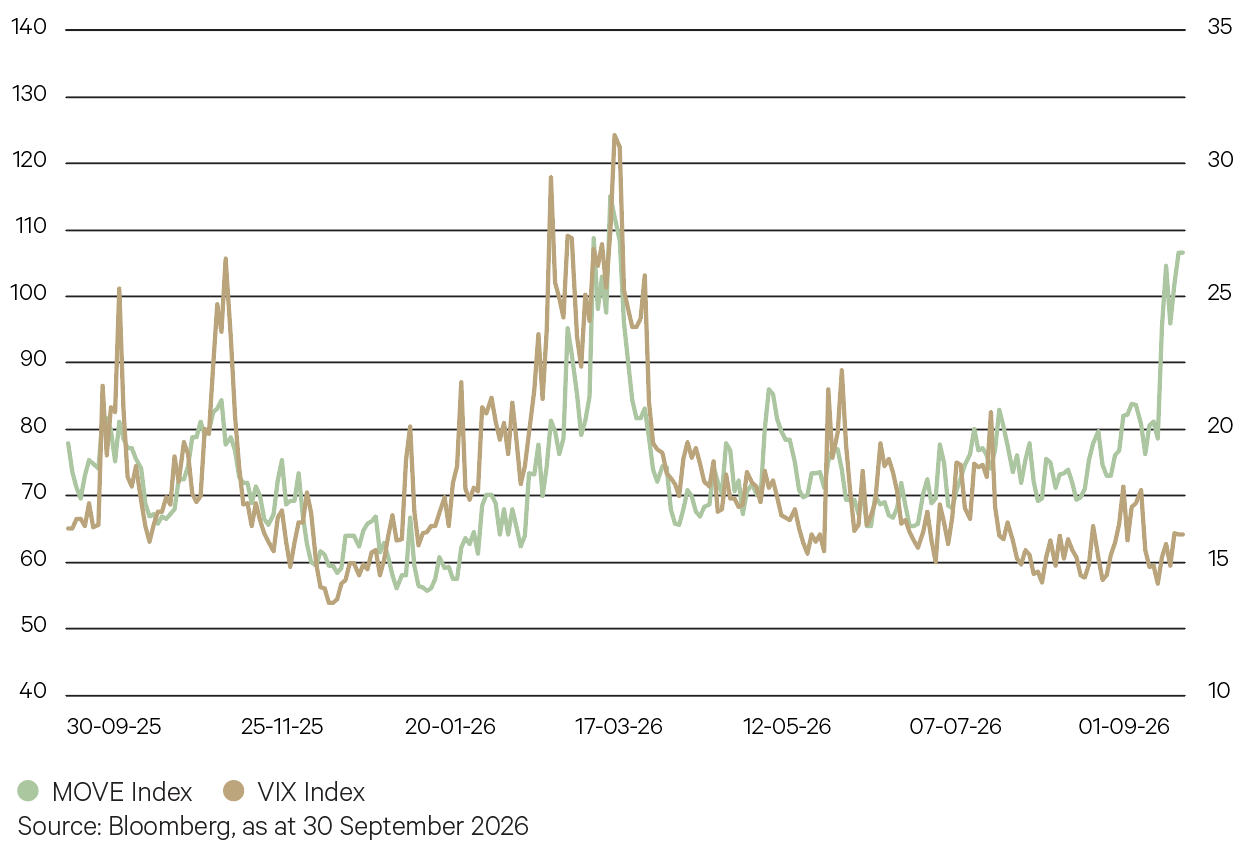
Further evidence that equity investors remain focused on corporate earnings strength rather than macroeconomic and geopolitical noise is reflected in bond and equity market volatility, as measured by the MOVE and VIX indices. Amid a sharp rise in long bond yields and repricing of the near-term path of monetary policy, bond volatility has spiked close to levels at the peak of the Iran conflict. Meanwhile, equity volatility has remained at low levels, with the VIX Index hovering in the mid-teens range.
Chart 7: Equity markets calm amid bond market turmoil


Key points
- The September quarter was one of consolidation for global equity markets and was characterised by the competing influences of underlying fundamental corporate earnings strength against macroeconomic headwinds, which limited share price appreciation.
- Weighing on asset valuations was a sharp rise in long bond yields to new multi-decade highs, with a further spike in the oil price contributing to inflation concerns and a growing view that further monetary policy tightening will be required. Fiscal sustainability concerns added to volatility as government debt levels continued to rise alongside the capital expenditure cycle.
- Stock and sector volatility was an additional feature, with the most noteworthy development a sharp correction in AI infrastructure stocks (including semiconductors) and a recovery in beaten-up software companies. Despite this, growth managed to outpace value for the quarter, while cyclicals and small caps were sold off the most on the aforementioned macro factors.
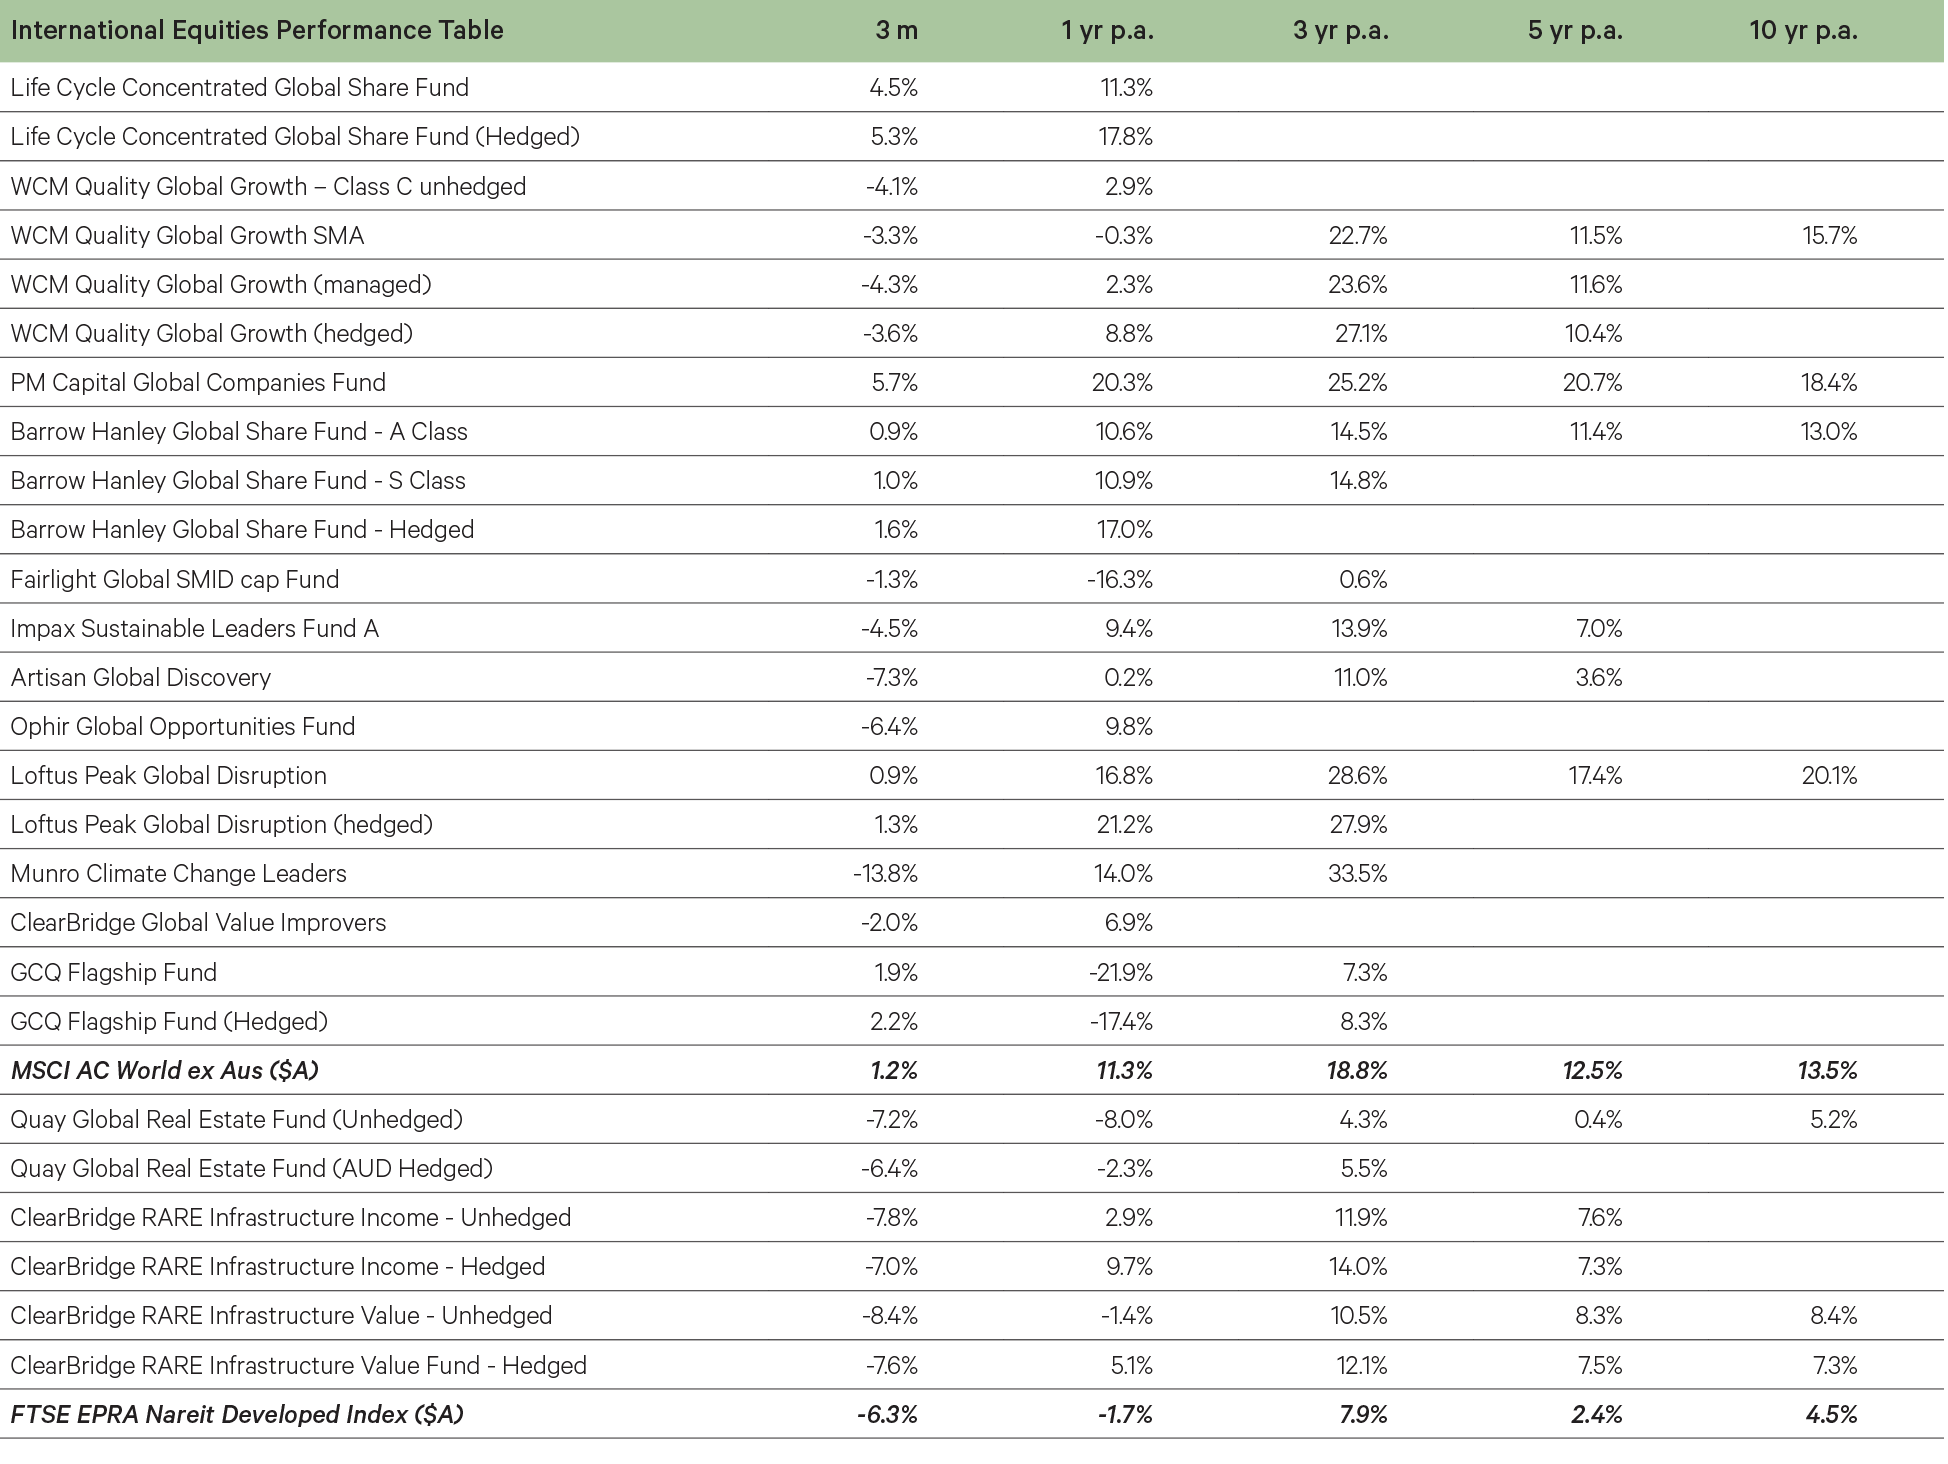
- Life Cycle was among our best-performing large-cap managers, with the manager’s portfolio holding up well amid the AI selloff and lifted by energy stocks. PM Capital also delivered a strong quarter, with stocks across its various thematics of banks, precious metals, and leisure & entertainment contributing to performance.
- The key laggards were funds most negatively impacted by the rise in bond yields. These included those with underlying real assets that typically are funded by higher debt levels, including ClearBridge RARE Infrastructure and Quay Global Real Estate. Small caps also underperformed in this environment, with yields weighing on valuations.
-
Fixed Income
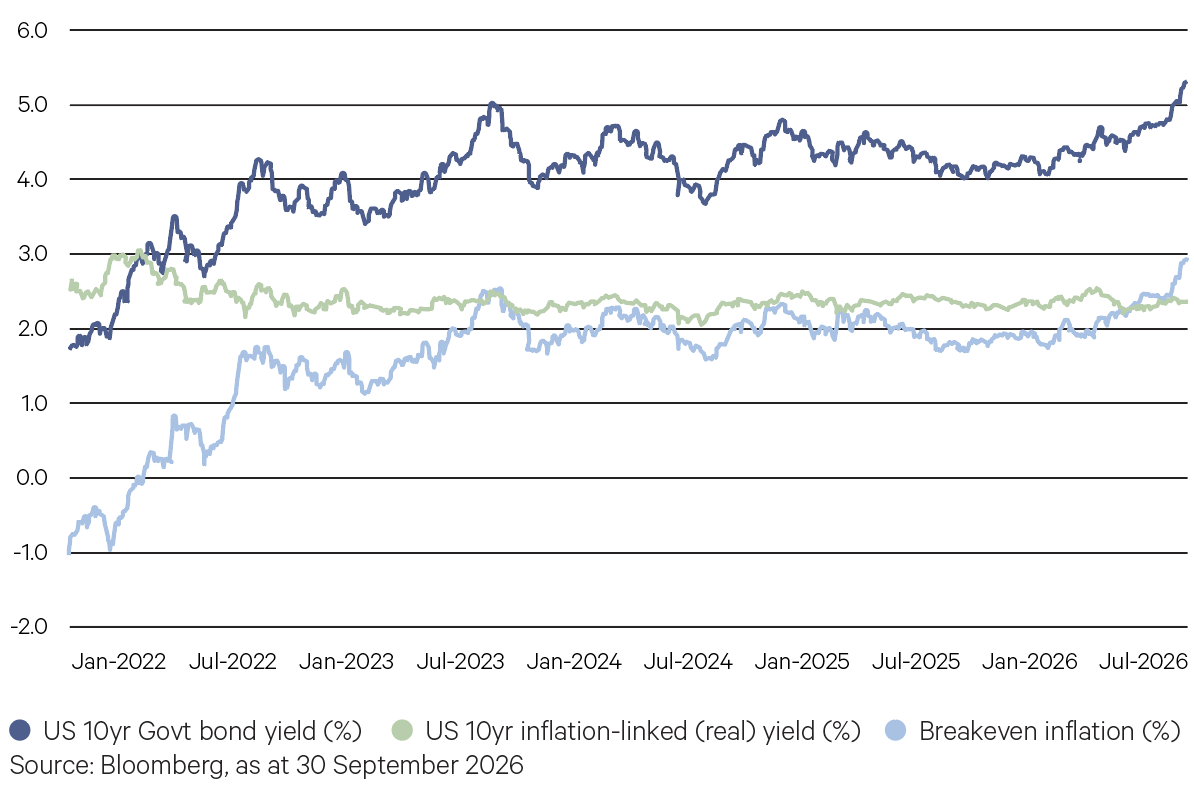
Since the start of 2022, US 10-year Treasury yields have risen from around 1.6% to 5.3%, while breakeven inflation (the market’s expectation for inflation) has fallen slightly to around 2.3%. This means the rise has come from real yields (the return investors receive above inflation), which have moved from around -1.0% to 2.9%, now well above their 2023 peak. This continued over the September quarter, with inflation expectations broadly unchanged. Investors are demanding a higher return to lend over long periods, mainly due to large government deficits, heavy bond issuance and AI investment competing for capital. As Australian yields tend to follow the US, this has flowed through to our market.
Chart 8: Real yields driving bond yields higher

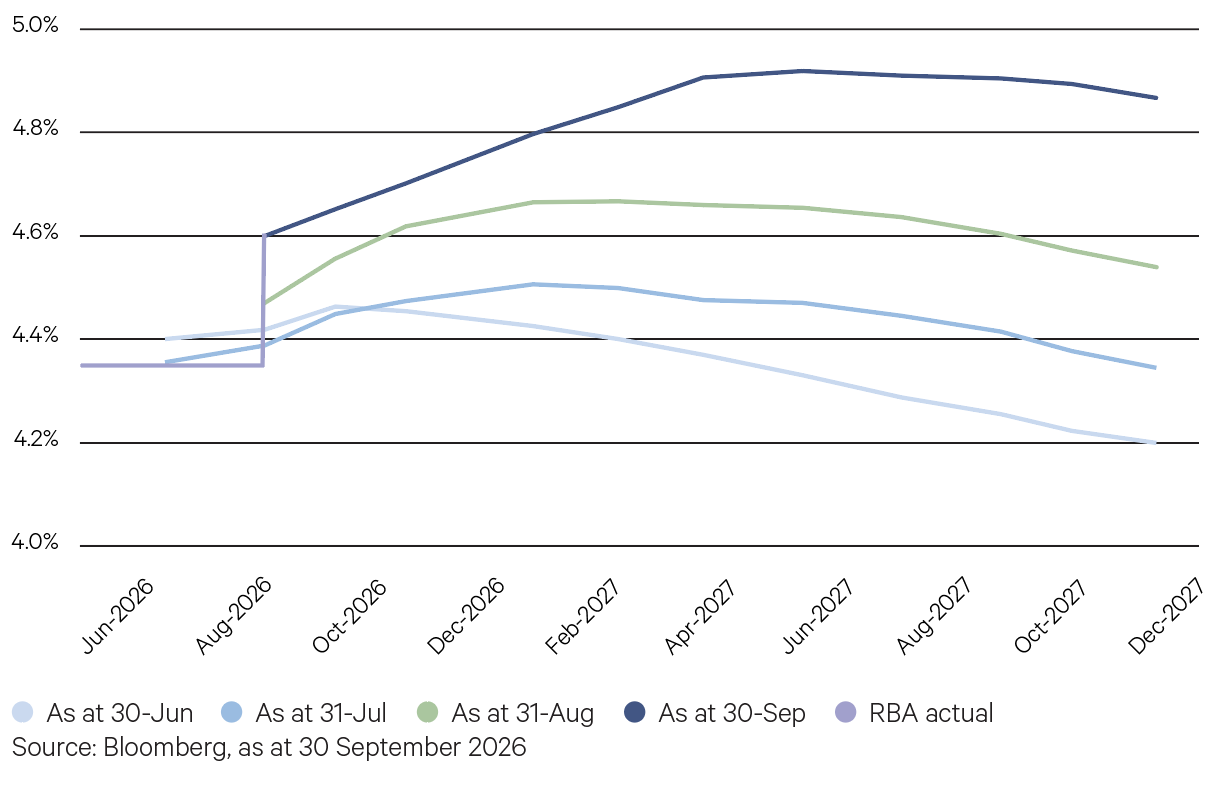
Domestically, interest rate expectations also shifted significantly over the quarter. At the end of June, markets were pricing at most one more hike, with the cash rate expected to peak at around 4.45% before easing back to around 4.20% by the end of 2027. Pricing moved higher each month as a hotter-than-expected July CPI print, stronger GDP data and a renewed rise in oil prices led the RBA to hike in September. By the end of the quarter, markets were pricing a peak of around 4.90% by mid-2027, with the expected cash rate at the end of 2027 around 0.65% higher than three months earlier. While this weighed on bond prices, it is a tailwind for floating rate notes (FRNs), as higher rates flow through to higher income.
Chart 9: RBA cash-rate expectations – evolution through Q3


Key points
- The September quarter saw a significant repricing in fixed income markets, with long bond yields rising to multi-decade highs globally. Australian bond yields typically follow the lead of US Treasuries, and this quarter was no exception. The US 10-year yield rose 82bps to 5.28%, its highest level since 2007, while the Australian 10-year rose 63bps to 5.35%, close to its highest level since 2011. Global credit spreads also widened across both investment grade and high yield, mostly in the final weeks of September, although they remained below their March highs.
- The RBA delivered its fourth hike of the year in September, taking the cash rate to 4.60%, its highest level since 2011. Earlier in the quarter a hike looked unlikely, with markets pricing less than a 20% chance ahead of the July CPI print. A softer August CPI has since eased some of the pressure, but further hikes remain priced in.
- In the US, the Federal Reserve hiked for the first time in three years and signalled further hikes are likely. In contrast to the bear flattening of the March quarter, yield curves experienced a bear steepening as long-term yields rose more than short-term yields, a sign that investors are demanding more compensation to hold government debt given large deficits and rising bond supply. UK and Japanese yields also reached multi-decade highs.
- Higher real yields have lifted the cost of capital just as AI hyperscalers are borrowing at record levels, with their bond issuance almost doubling this year to around US$250 billion. While banks and insurers provide a steady source of demand for government debt, other corporate borrowers must compete with the hyperscalers for the same capital. In August, Alphabet (Google’s parent company) issued its first Australian dollar bond, raising $5.5 billion, the largest corporate bond deal in Australian history, with over $18 billion in demand.
- Australian credit spreads widened modestly over the quarter. Higher quality segments held up well, with major bank senior and RMBS spreads only slightly wider, while major bank Tier 2 and hybrid spreads both widened by around 12bps. Public credit markets remained deep and liquid, in contrast to private credit markets.
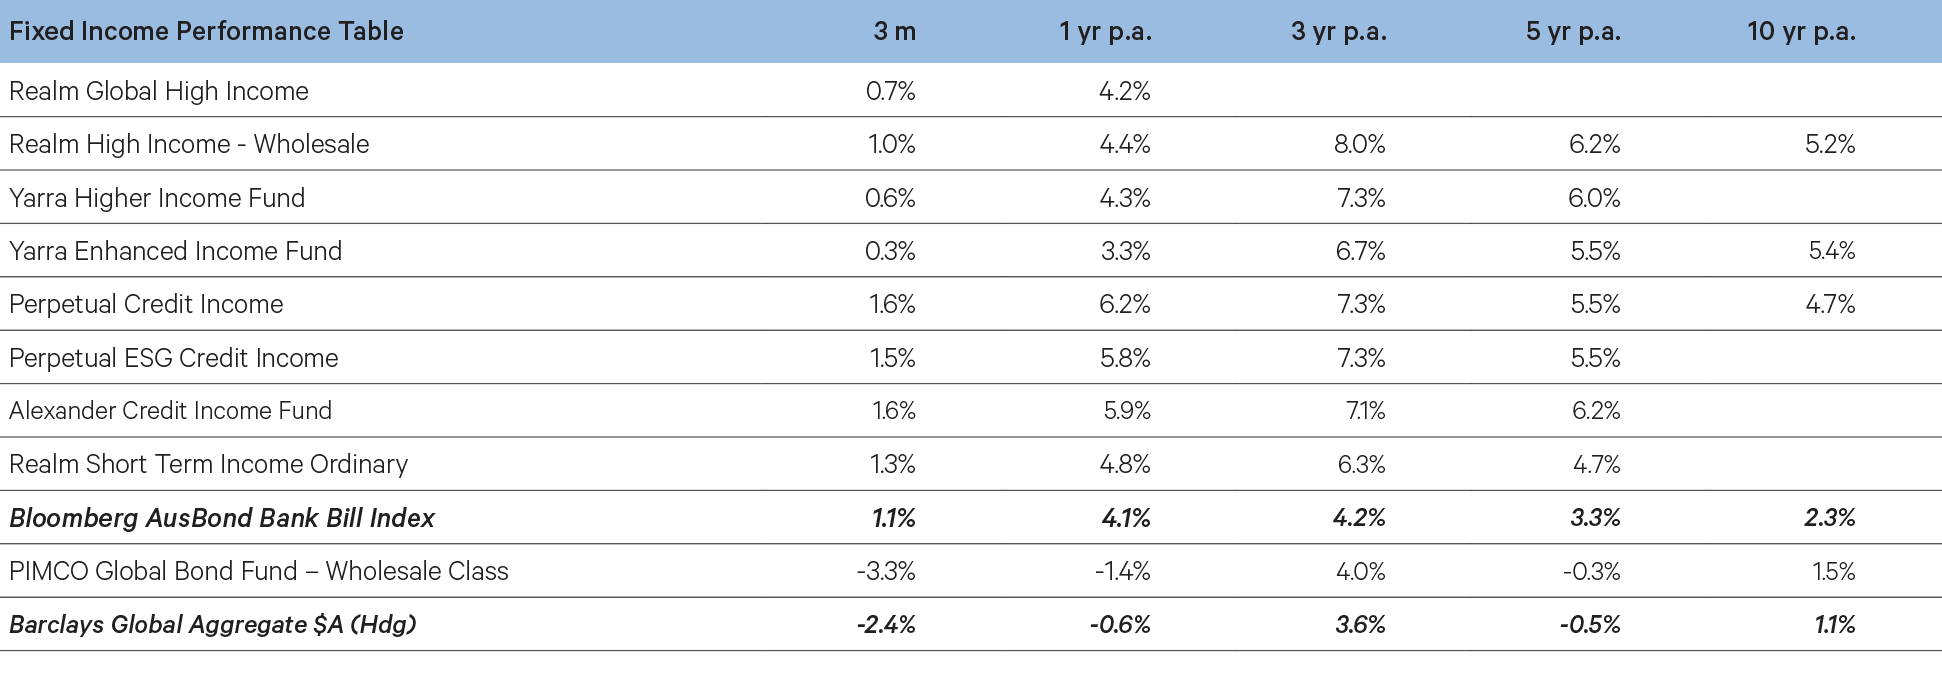
- Our liquidity funds performed well given their low exposure to interest rate risk and lean towards higher credit quality, with Alexander Credit Income and Realm Short Term Income both outperforming the Bank Bill Index.
- Results were mixed across our credit funds, with credit spread duration (a fund’s sensitivity to changes in credit spreads) the key driver of performance. Perpetual Credit Income has the lowest spread duration of our credit funds and led the way, while Yarra Enhanced Income, with a longer spread duration, was most impacted as spreads widened late in the quarter.
- Interest rate duration was the key detractor, with the AusBond Composite returning -1.5% compared to 1.2% for the AusBond FRN Index. PIMCO Global Bond underperformed its benchmark as global yields rose.
-
Alternatives
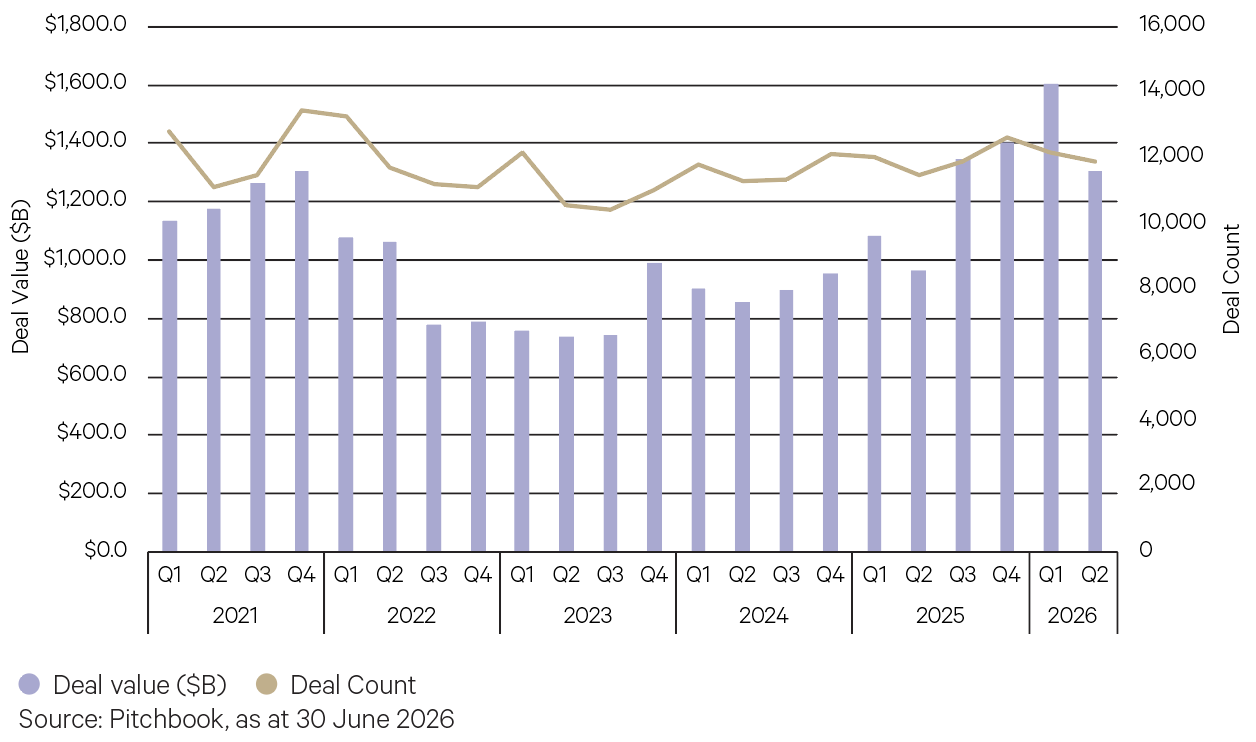
Large strategic transactions dominated global M&A in Q2 2026. PitchBook estimated announced deal value at $1.3 trillion, up 35.3% from $965.7 billion a year earlier but down 18.4% from $1.6 trillion in Q1 2026, while transaction volumes were broadly unchanged. Deals worth at least $5 billion represented almost 42% of quarterly value, indicating that activity remained broad, but capital was disproportionately concentrated in the largest transactions. Persistently high borrowing costs continued to create the greatest headwind for deals reliant on debt funding.
Chart 10: Global M&A Activity

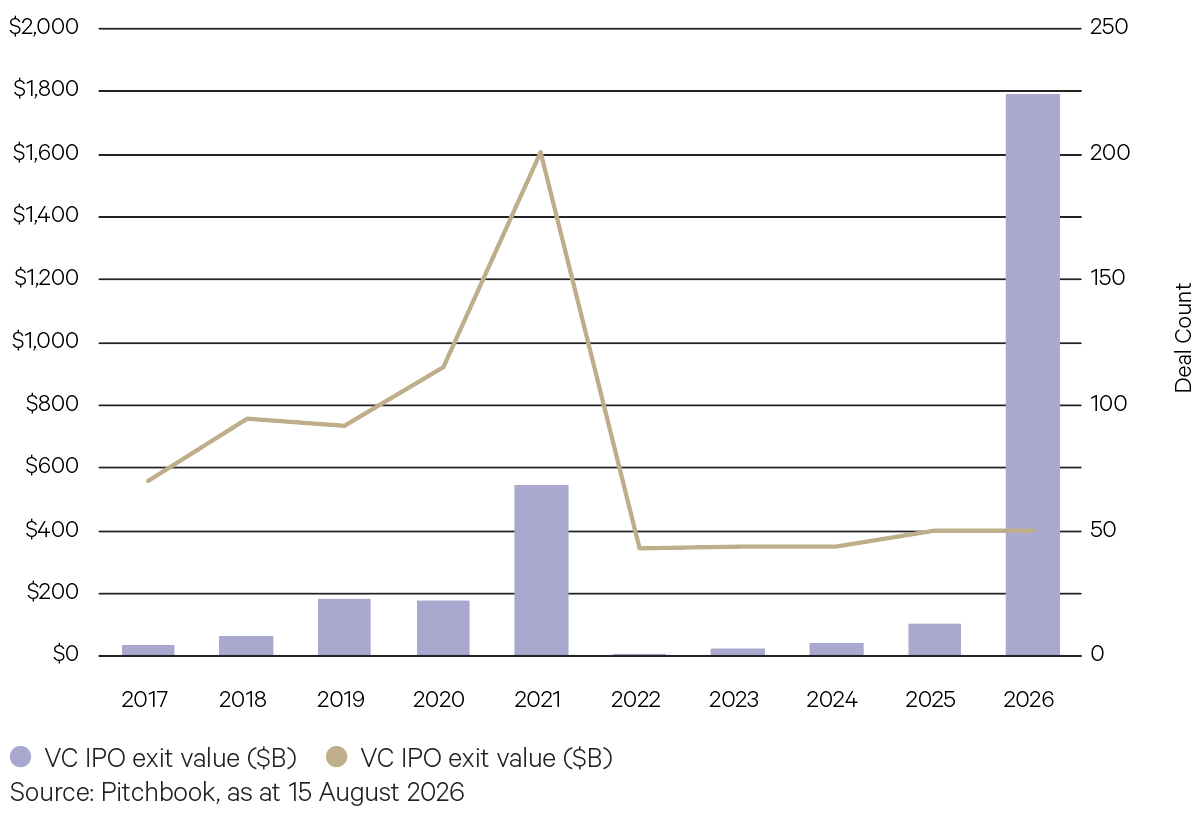
Public markets have traditionally provided growth capital when companies outgrew private funding, while also offering shareholders broad liquidity. Since 2022, however, deeper private funding pools and more active secondary markets have enabled startups to remain unlisted for longer, even as interest rates rose. A growing mismatch between private and listed-market valuations has raised the hurdle for new listings. Strong interest in AI has pushed private valuations higher, while rising expenses and softer revenue growth mean many startups do not yet meet public investors’ expectations. New listings are expected to remain scarce, with those that reach public markets likely to be larger, more established businesses seeking to advance specific strategic priorities.
Chart 11: US VC-backed IPO activity


Key points
Private Equity
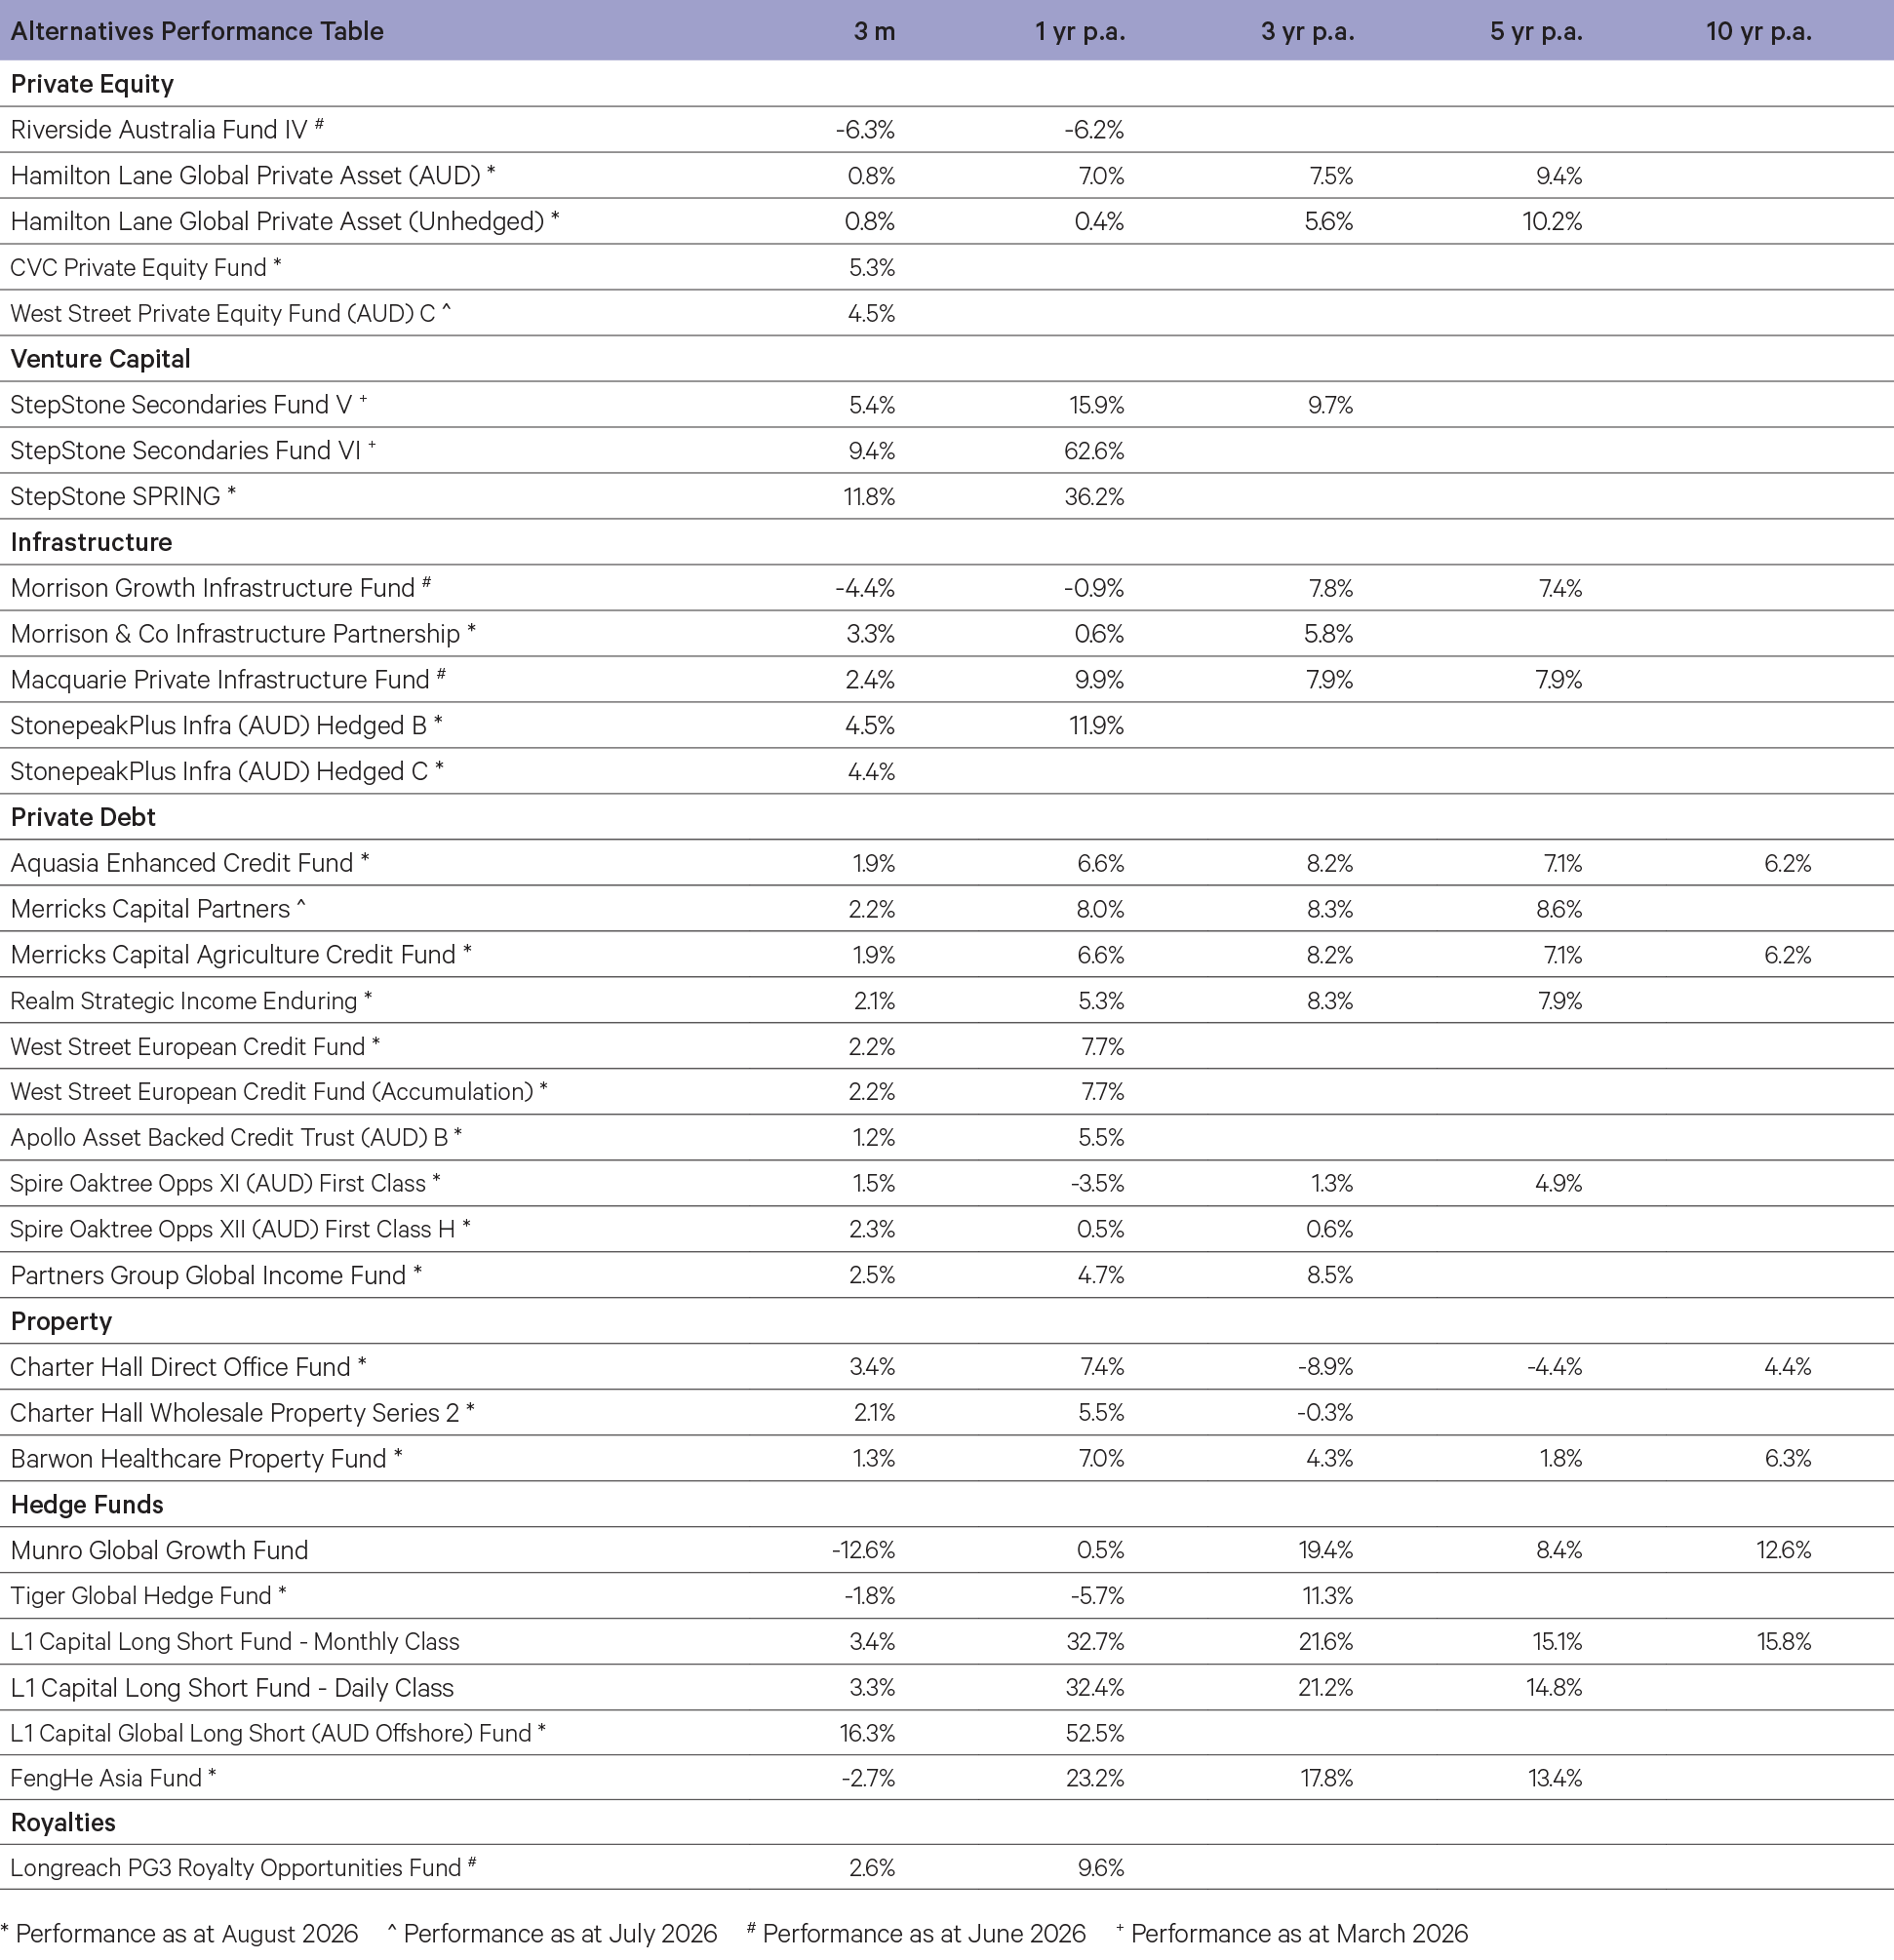
- CVC Private Equity Fund returned +5.3% for the three months ending August 2026. Earnings growth across the underlying portfolio companies has been the largest contributor to returns. Within the direct private equity holdings, Bamboo Insurance, Dream Games and Public Power Corporation were strong contributors. Uplifts across the secondaries portfolio were also additive to returns led by an LP position in Project Tyche.
- Hamilton Lane Private Assets Fund (Unhedged) returned +0.8% for the three months ending August 2026. Portfolio performance was positive over the period, supported by gains from secondaries and co-investments. A key contributor was Echo Global Logistics, a North American third-party logistics business in which Hamilton Lane invested alongside The Jordan Company.
Private Debt- West Street European Private Credit Fund returned +2.2% for the three months ending August 2026.
- Underlying loan income was strong during the period, with the fund predominantly invested in directly originated, floating rate first lien loans. The portfolio spans eleven sub-sectors across twelve countries. A major new position was established in GBA Group, a German-headquartered operator of a global laboratory network. The fund also committed financing to support Bridgepoint’s acquisition of the company from Ardian.
- Partners Group Global Income Fund returned +2.5% for the three months ending August 2026. European secondary loan prices rose as seasonal issuance slowed, while limited supply continued to support US market conditions. Software, Healthcare, and Materials were the leading sector contributors, with the US allocation making the largest regional contribution to overall performance.
Hedge Funds- L1 Capital Long Short returned +3.3% (Daily class) for the three months ending September 2026. Gold equities, including Eldorado Gold and Westgold Resources, performed strongly as operating leverage and record cash flows supported dividends well above market expectations. Hudbay Minerals and Capstone Copper were also notable contributors.
- Equity long-short manager Munro Global Growth returned -12.6% for the three months ending September 2026. Long positions, hedging and currency movements detracted from performance, with an early-period sell-off in AI and semiconductor stocks weighing heavily on returns. The main detractors included positions in Applied Materials, ASM International and Nokia.
Venture Capital-
StepStone Private Venture and Growth Fund (SPRING) returned +11.8% for the three months ending August 2026, with SpaceX’s IPO the largest individual contributor. Momentum also remained strong across emerging portfolio companies. Overland AI secured a US$20 million US Army contract to develop autonomous systems for obstacle- and minefield-breaching missions, while Varda Space Industries raised US$251 million in a Series D funding round at a US$1.6 billion valuation. Several other portfolio companies also recorded valuation gains following fundraising rounds and tender offers.
Infrastructure-
The Macquarie Private Infrastructure Fund returned +2.4% over the June quarter. During the quarter, the fund benefitted from positive performance across the majority of its investments, with notable positive contributors including Applied Data Centers and the Port of Newcastle.
-
Stonepeak Plus Infrastructure returned +4.4% for the three months ending August 2026, supported by valuation gains in Cologix and Princeton Digital. Cologix’s uplift reflected strong operating performance, with new facilities progressing on schedule and a focus on development and pre-leasing. Princeton Digital’s increase was driven by strong commercial momentum and additional customer contracts across Johor, Jakarta, Mumbai and Tokyo.