-
Q3 in review –
Caution wrapped inside optimism rolled up in scepticism
The third quarter of 2025 was marked by a dramatic rebound in global financial markets, driven by a mix of policy shifts, earnings strength, technological optimism, and easing macroeconomic pressures. The US benchmark equity index, the S&P500, added $US15 trillion in market value from the lows in early April and has notched 27 records so far in 2025. Its 34% gain over the past five months is a feat topped in just four other instances since 1950. Monetary and fiscal policy easing remains the market’s central anchor. But the scale and speed of the rally have injected a note of caution – and more than a hint of scepticism – over whether policy optimism and liquidity, rather than fundamentals, are now driving the advance.
1. Gold shines brightest
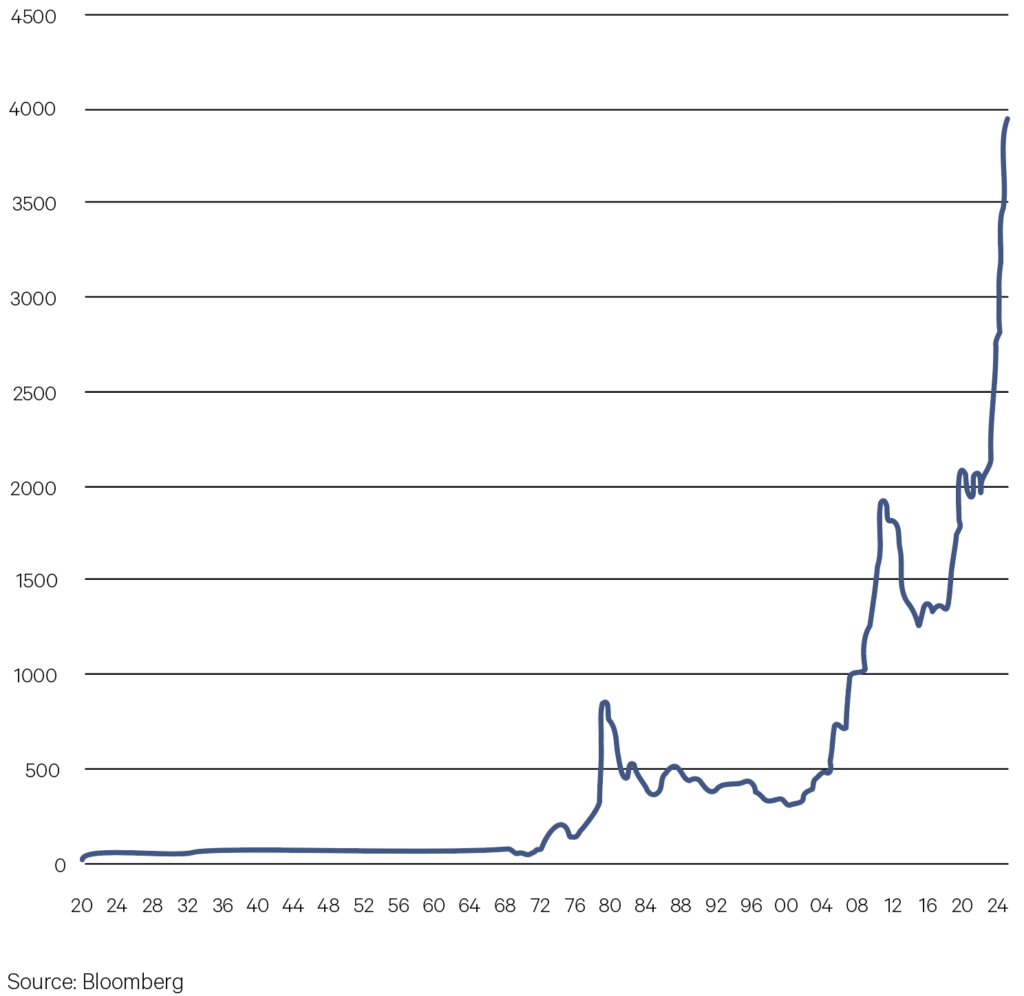
Gold delivered the month’s loudest signal. Its rally to record highs—the strongest since 2011—was more than just momentum. It was the market hedging against cracks forming beneath US dominance.
With deficits swelling, political polarisation deepening, and rivals openly challenging the dollar’s supremacy, investors are reaching for the oldest hedge against uncertainty.
Chart 1: Gold price (USD per ounce)

2. Money, money, money
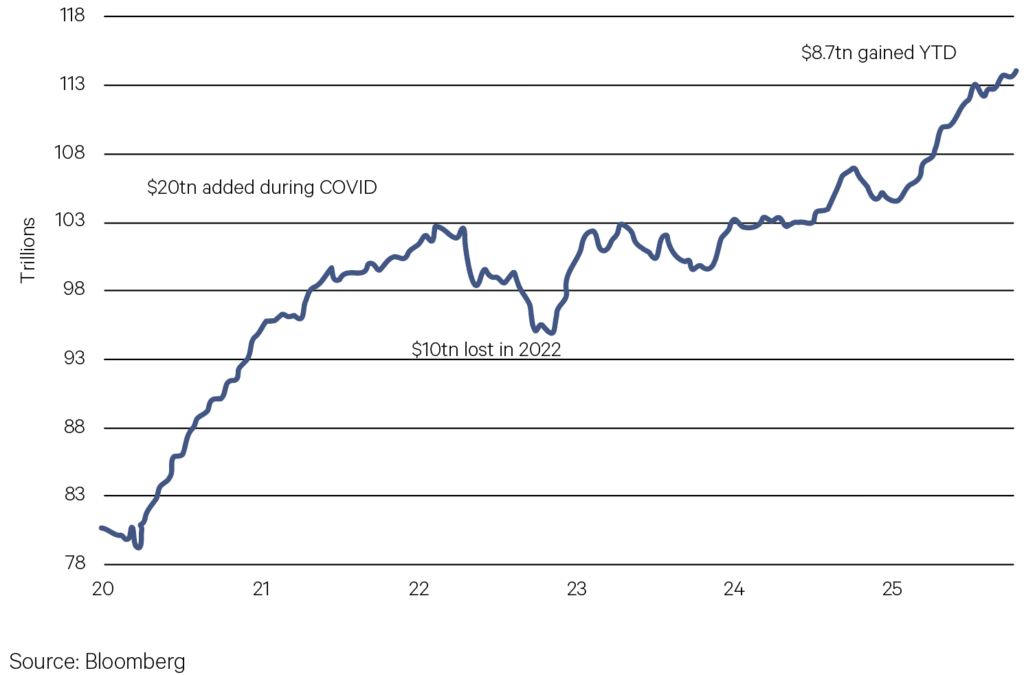
Why are equities performing so well this year? In short, governments keep pumping money into the system. Nearly US$9 trillion has been added to global money supply year-to-date—almost half the US$20 trillion injected during the pandemic. Back then, the spending was necessary; today, it’s a political hangover.
Governments are struggling to withdraw fiscal support without backlash. France has lost its third Prime Minister in a year and the UK’s leader is historically unpopular. Meanwhile, Japanese equities surged on the election of a new LDP leader favouring loose fiscal policy. Watch this space for what happens next in markets.
Chart 2: Global money supply (USD, trillions)

3. A tariffying wait
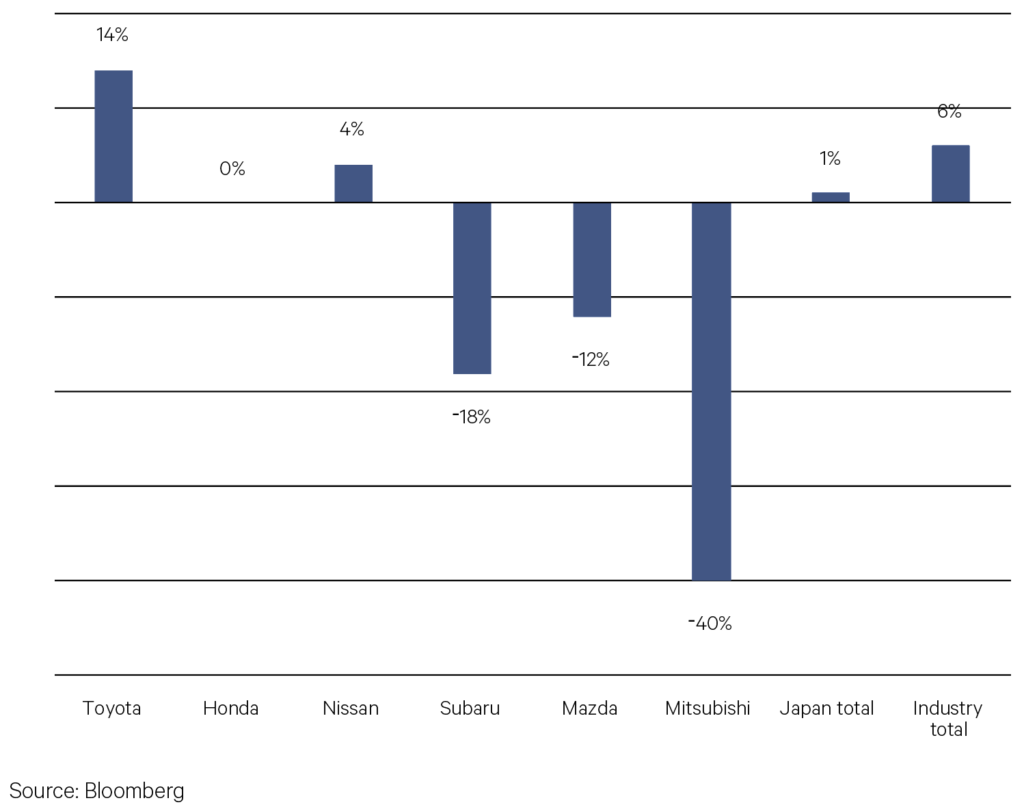
The Adobe Digital Price Index showed deflation across online categories in July—including electronics and apparel—suggesting that tariff pass-through remains muted on the U.S. consumer side. Consumers, it seems, aren’t paying more. Rather, exporters are earning less. That tracks with what we’ve seen anecdotally in retail earnings and freight data: front-loaded inventory builds, strategic markdowns, and competitive price compression that mutes the inflationary transmission mechanism.
It’s not U.S. consumers or corporates footing the bill. It’s the exporters. Japan’s automakers are a case in point. According to Japan’s Ministry of Finance, passenger vehicle exports to North America plunged 24.7% in value in May yet fell just 3.9% in volume implying a 20.8% drop in price.
Chart 3: Japanese US auto sales (yoy %)

-
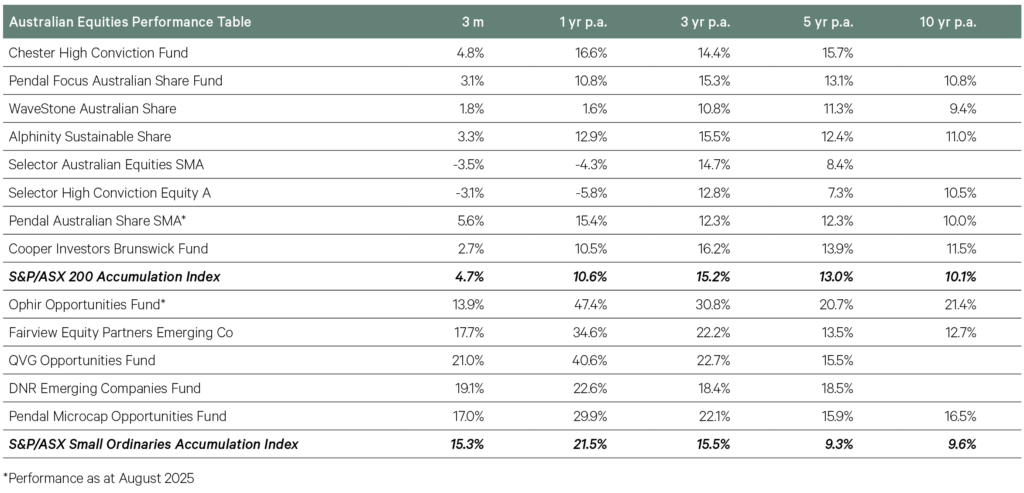
Australian Equities

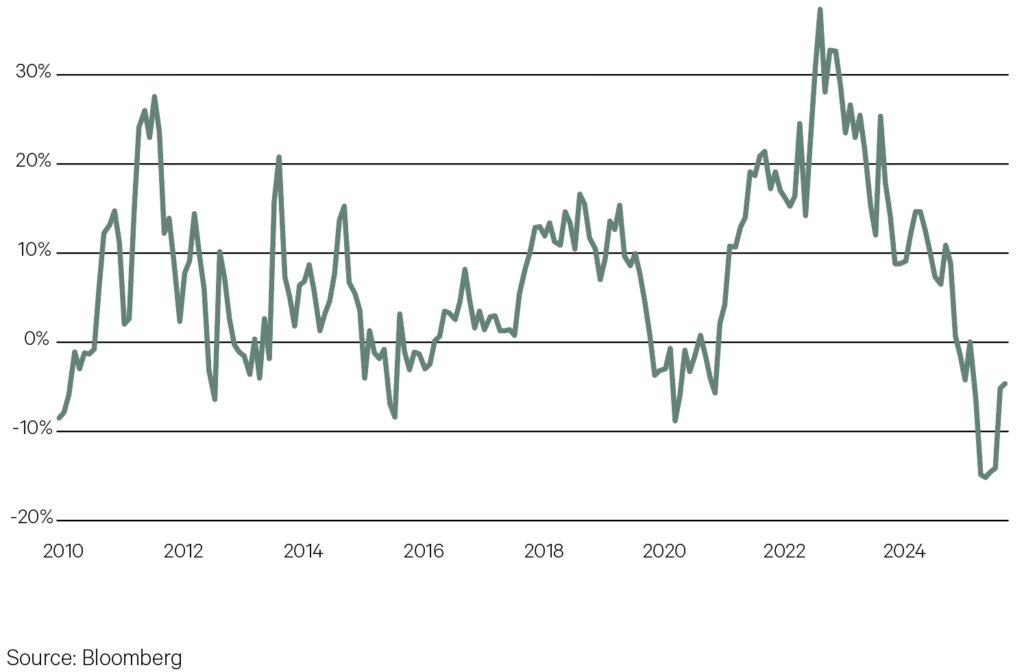
In the September quarter, Australian small caps had their best quarter of performance relative to large caps in more than 15 years.
This arrested a trend of the last three and a half years, whereby small caps had underperformed in 12 of the last 14 quarters. While small resources were particularly strong, rising 25%, returns in small industrials were also solid, rising 11% in the quarter. A more constructive outlook for the domestic economy was reflected in a large part of the small cap index’s gains recorded in August.
Chart 4: Small caps bounce back relative to large caps

Despite the relative strength in the September quarter, domestic small caps still trade at a discount to large caps, although the gap has recently narrowed. After rising inflation and interest rates and weaker earnings hurt small caps from early 2022, a reversal of those macro trends has been seen as a potential catalyst for small caps
to outperform once again. Historically, small caps have traded on a P/E premium of ~7%, indicating that the relative performance trend may have further to run.Chart 5: Small caps close P/E discount to large caps


Key Points
-
The Australian equity market again made steady gains in the September quarter, with a total return of 4.7% for the three months. Despite this solid return, the domestic market lagged the strong returns of international equity markets.
-
August’s reporting season was a key driver of individual equity returns as companies reported their full year results to the market. Reporting season was marked by an elevated level of share price volatility, which extended to typically more stable large cap companies. Another key takeaway was more positive commentary from domestically-focused companies, while industrials with an international focus struggled somewhat. Overall, while reported earnings were weaker compared to expectations, the Australian market still managed to outperform over the course of the month.
-
The RBA cut the cash rate by 25bps for the third time this year in August, providing further support for the equity market through the quarter. However, by the end of September there was a growing view that we are now getting closer to the end of the easing cycle through a combination of a pick up in economic indicators, an upside surprise in the August monthly inflation data and ongoing weak productivity growth. This was in contrast to the US, where a softening labour market is leading
to the likelihood of more cuts by the Fed in the next 6-12 months. -
Sector performance was again disperse in the Australian market in the September quarter. The materials sector led the way, gaining more than 20%. Gold miners continued their positive momentum, while lithium stocks rebounded from their lows and the big diversified miners also generated strong returns on the back of higher iron ore and copper prices.
-
Health Care was again a key laggard, which was in large part held back by a negative reaction to CSL’s full year result, a widely held large cap stock among active managers and the biggest stock in the sector.
-
Both of these factors provided a significant headwind for growth-focused managers, such as Selector in our large cap strategies. The IT sector also underperformed, primarily due to the soft performance of larger companies in the index, including Xero, WiseTech and TechnologyOne.
-
Our core large-cap strategies also lagged the benchmark to a smaller degree, in part driven by the selloff in popular holdings through reporting season, including CSL, James Hardie and Xero. Chester was our best performed mid cap strategy, again helped by the strength of the gold sector through the quarter.
-
The performance of Australian small caps was the highlight, as they outperformed large caps in each month, including a 8.4% rise in August. Overall, the benchmark small cap index jumped by 15.3% in the quarter, helped by a 25% gain in small resources.
-
All of our small cap funds were able to add alpha above the index, adding to impressive rolling year returns. QVG was the standout, rising 21%, with particularly strong gains from its largest holdings, including Generation Development, Life360 and Aussie Broadband.
-
-
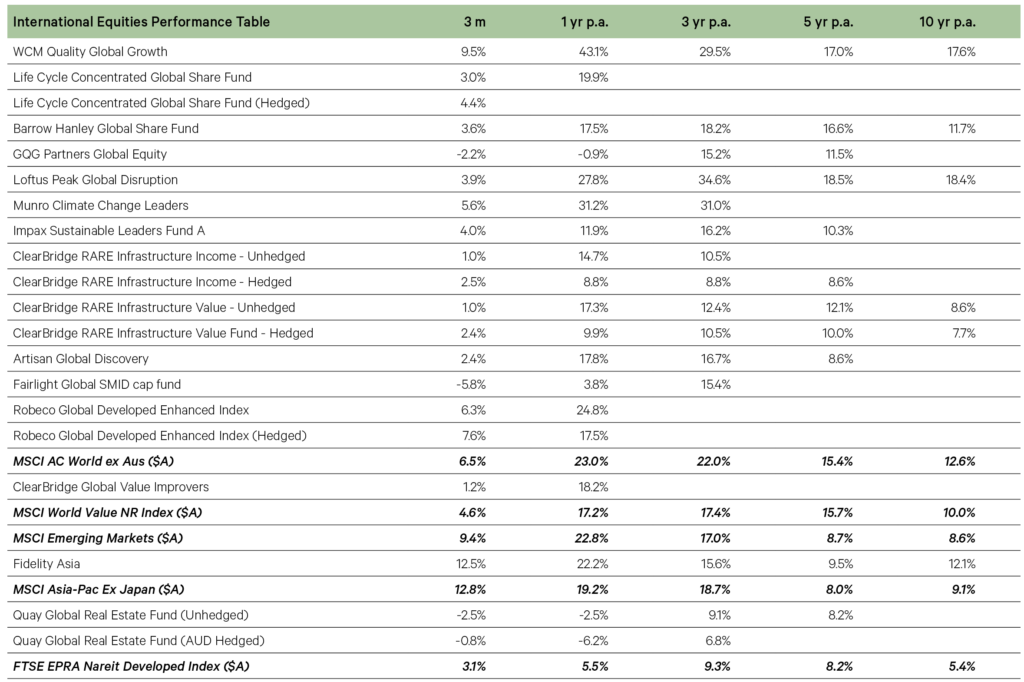
International Equities
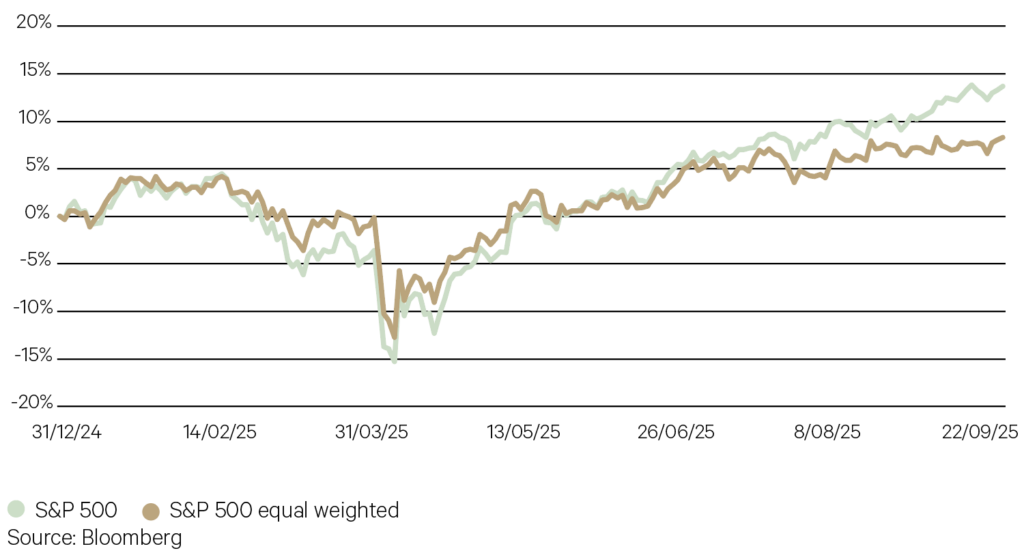
For the S&P 500, the last two calendar years have been notable for the concentration in the index’s returns from the large technology and AI-driven companies, often referred to as the ‘Magnificent 7’. An indicator of this is comparing the performance of the S&P 500 with that of the equal-weighted index; if the latter is outperforming it shows that the index is being driven by a broader group of companies. While market breadth has improved somewhat this year with more contributors to the index’s return, the equal-weighted index still lags the S&P 500 by 5% year to date.
Chart 6: Market breadth improves, but Magnificent 7 still lead the S&P 500

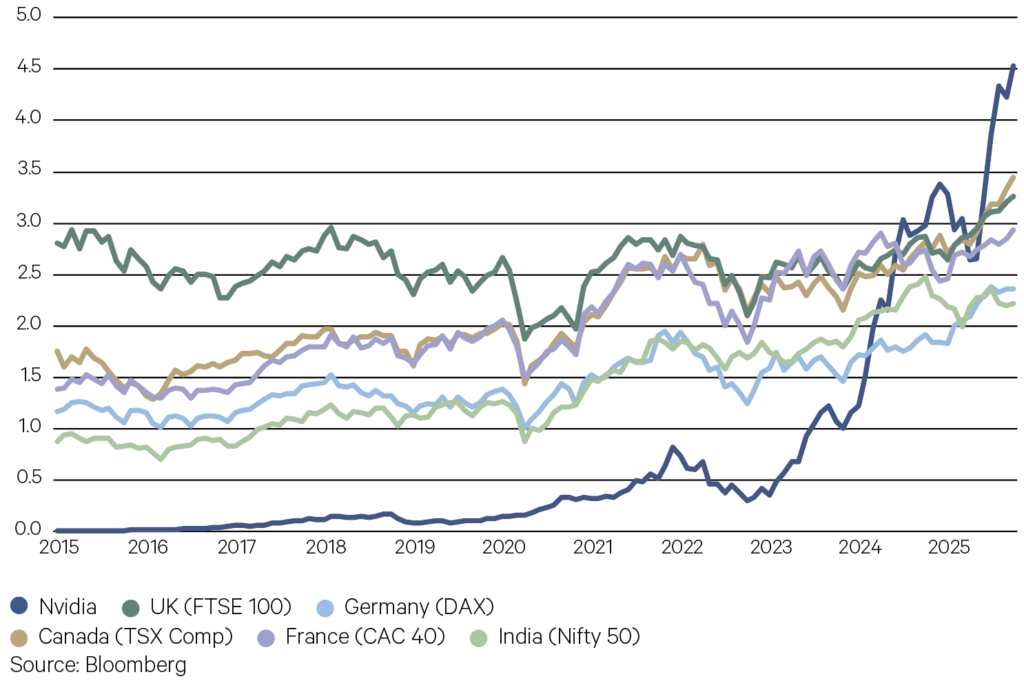
Nvidia passed another milestone in the last quarter—becoming the first company to reach a market capitalisation of US$4 trillion, just two years after passing the US$1 trillion benchmark and the stock has again soared after a brief DeepSeek-driven drawdown early this year. Nvidia’s soaring valuation now sees it with a greater market capitalisation than the entire listed value of most equity markets around the world, including the key benchmarks in Canada (TSX Composite), UK (FTSE 100), France (CAC 40), Germany (DAX) and India (Nifty 50).
Chart 7: Nvidia now worth more than entire country equity markets (market cap US$tn)


Key points
-
Global equities recorded a strong quarter, rising by 6.5%, building on the recovery after the Liberation Day-driven drawdown in April. The Australian dollar was stable over the quarter, with similar returns from hedged and unhedged strategies.
-
A clearer picture of US trade policy and tariffs was a key macro driver early in the quarter, giving more certainty for investors.
-
In September, a pivot from the Fed saw the central bank cut the cash rate by 25bps, with a cooling labour market the catalyst. With further monetary policy easing now anticipated, the strength in equity markets pointed towards a broad expectation of a ‘soft landing’ scenario whereby a recession is avoided. Lower bond yields and this dovish Fed pivot contributed to outperformance of small caps.
-
In developed markets, the winners were the US and Japan, with both key indices delivering double digit returns, while there was more modest low single-digit gains across Europe. Emerging markets were strong, rising 10% on the back of easing trade tensions, a weaker US dollar and technology leadership in China and Taiwan.
-
Following a solid June quarter earnings season, IT and communications led sector returns, delivering outperformance for the Nasdaq and growth-biased managers, while more value-orientated strategies lagged. Cyclicals also outperformed defensives, with utilities the only sector of the market to decline.
-
WCM’s largest holding Applovin more than doubled, while the strategy also benefited from gains in Taiwan Semiconductor Manufacturing and Robinhood Markets. After a strong June quarter, Loftus Peak’s returns moderated.
-
Fidelity Asia was also a strong performer, which was enhanced by gains in China and Hong Kong. These markets were boosted by increased liquidity and retail investor participation.
-
Funds that are more defensive lagged the broader market, including Clearbridge and Quay infrastructure and property funds, and the GQG Partners Global Equity Fund. GQG’s underperformance was attributed to two key themes across the portfolio—a large underweight to technology and an increased weight to the defensive utilities sector.
-
In small caps, Fairlight underperformed due to an overweight to Europe over the US along with a low exposure to more cyclical sectors and stocks which have recently driven the market higher.
-
-
Fixed Income
Since the late 1990s, the Bank of Japan has faced a challenge in keeping inflation to its target of 2%—a goal that’s proven elusive due to recurring bouts of deflation. Deflation is typically associated with economic slowdowns: when demand drops, prices fall, unemployment rises, and the real cost of debt increases, making it harder for both consumers and businesses to spend and invest. Given this backdrop, it’s understandable that the Bank remains cautious about raising interest rates from their ultra-low levels. Despite CPI running above 2% for more than three years, the BOJ can’t ignore the risk to the economy of slipping back into deflation.
Chart 8: Japan Consumer Price Index (%)

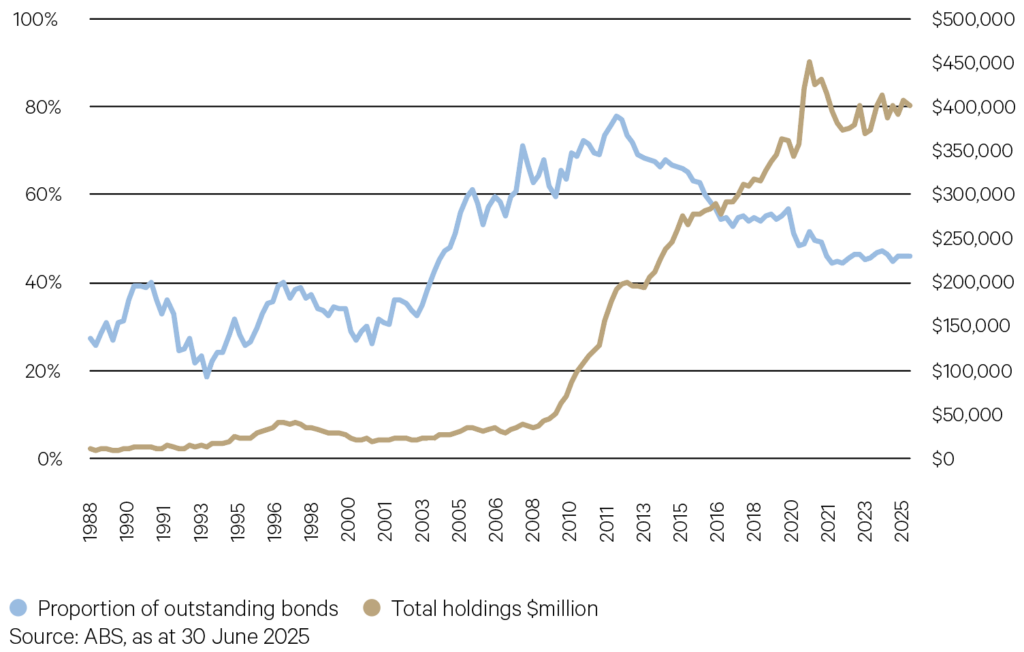
Australia’s reputation in the global marketplace is growing—particularly among fixed income investors. Foreign ownership of Australian sovereign bonds sits at over $400b—nearly half of all outstanding issues, with corporate bonds also seeing increased inflows. The appeal is underpinned by several factors: the increased depth and liquidity of Australia’s bond market, higher relative yields (particularly compared to Japan), and a regulatory environment that promotes transparency and stability. For international investors, the availability of foreign exchange hedging also adds an extra layer of confidence when allocating capital to Australian fixed income assets.
Chart 9: Foreign Ownership of Australian Government Bonds


Key points
-
The fixed income market was volatile over the September quarter, driven by significant surprises in economic data that signalled deterioration in several major economies. US yields ended the quarter lower, while Australian yields rose as inflation proved stickier than expected. Credit spreads tightened as capital continued to flow into the Australian market.
-
Diverging economic data challenged several central banks over the quarter, with officials in Australia, the US and the UK contending with worsening labour markets and persistent inflation prints. In Australia, the RBA met three times, surprising the market which had fully priced a rate cut by holding steady in July. The central bank then cut 25bps in August on the back of weaker jobs data before returning to their holding pattern in September as the monthly CPI print proved stubborn.
-
President Trump ramped up his conflict with the Federal Reserve, raising fears of politicisation of the rate setting process and steepening the yield curve. The ensuing legal battle was decided in favour of the Fed, helping to confirm the central bank’s independence and ease investor fears.
-
The Federal Reserve at their annual symposium in Jackson Hole committed to more decisive action on inflation in the future, promising the mistakes of the “transitory inflation” era wouldn’t be repeated. The Fed met twice, cutting for the first time this year in September on the back of significant deterioration in the labour market. Members are more divided on the outlook for rates, with two dissents at the July meeting and one in September.
-
In Europe, France faced another no confidence vote in their parliament, and the yield on French sovereign bonds surpassed Italy’s for the first time this century as investors reappraised sovereign risk.
-
Weather seemed to be the only thing on the UK’s side in the quarter, as growth slowed, unemployment rose and new taxes weighed on business, all while inflation continued to rise. With summer firmly over and tax rises on the horizon, the outlook is bleak.
-
Falling yields in the US helped funds with US duration exposure, with the PIMCO Global Bond returning 1.5% over the three months, nearly 0.5% above its benchmark. The fund maintains an overweight duration position against the benchmark of around half a year, increasing its sensitivity to interest rate movements.
-
Credit spreads continued to tighten, combining with still attractive yields to generate a strong quarter for our credit funds. All APL credit funds generated significant alpha in the period, well above their target returns.
-
Our liquidity funds were true to label over the quarter providing a stable yield as well as high levels of liquidity. They continue to outperform their targets over all time periods.
-
-
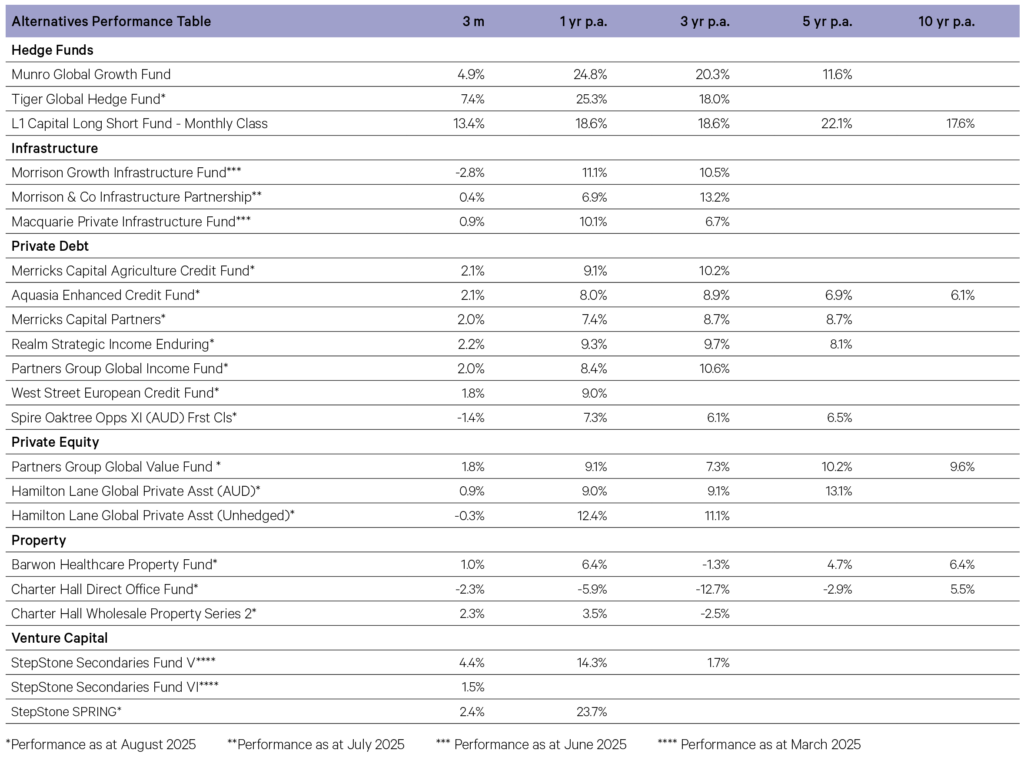
Alternatives
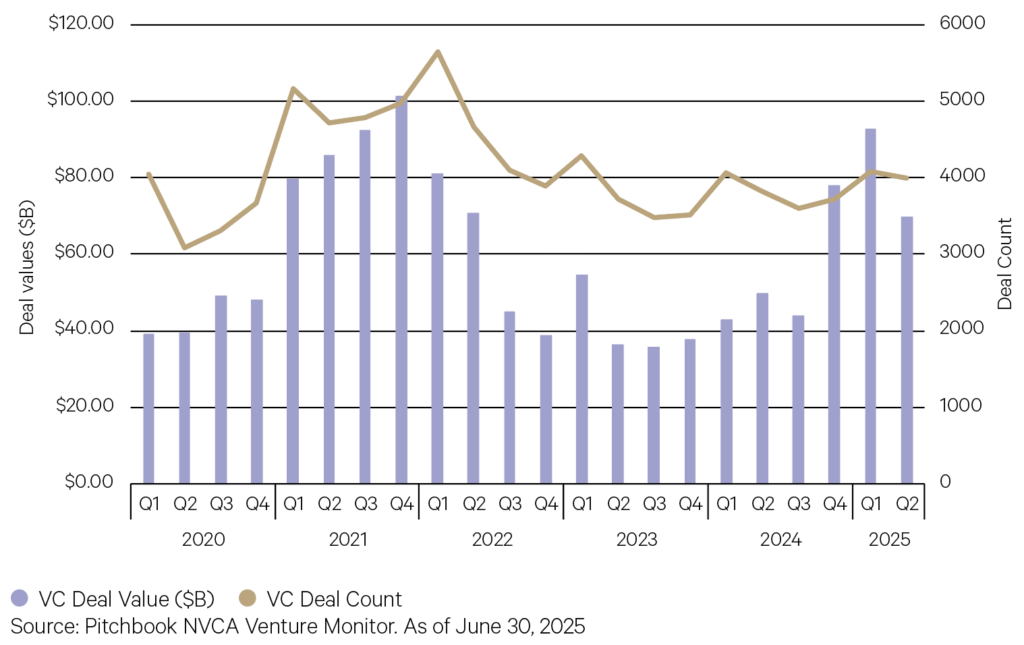
H1 2025 global VC deal activity was robust driven by momentum in AI. Pitchbook reports more than half of 2025 deal value and 30% of completed deals have gone to AI startups, highlighting investors’ focus. Contributing to the activity in 2025 has been several outsized deals headlined by OpenAI’s $40 billion round from Q1. In Q2, five AI deals topped $1 billion, including Scale AI featuring Meta purchasing a 49% stake in the company, Safe Superintelligence, Thinking Machine Labs, Anduril, and Grammarly. The sector represented 64.1% and 35.6% of H1 2025 deal value and count, respectively, highlighting sustained investor conviction.
Chart 10: VC deal activity by quarter

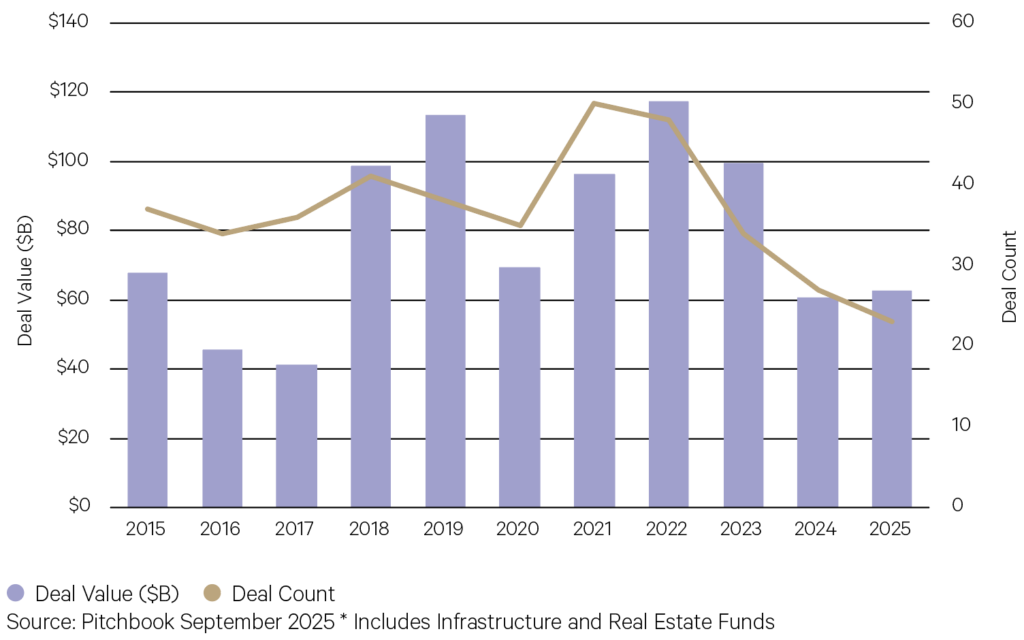
Digital infrastructure and real estate are becoming more closely intertwined, driven by the rise of data centres, 5G technology, and AI. Enterprise and consumer digitalization are driving substantial increases in data consumption, transforming digital infrastructure globally. Goldman Sachs Global Investment Research expect a 165% increase in power demand through the rest of the decade, driven by both accelerating adoption of AI and non-AI technological needs and the corresponding appetite for power that will require both renewable and conventional energy. Year to date, there’s been circa $62.7 billion invested into funds dedicated to digital infrastructure.
Chart 11: Fundraising for digital infrastructure


Key points
Infrastructure
-
The Macquarie Private Infrastructure fund returned +0.95% over the June quarter. The fund benefitted from positive performance across the majority of its private infrastructure investments most notably it’s Americas and Australian assets. Listed infrastructure was also a positive contributor, while USD FX movement was the largest detractor from returns. Notable asset contributors included the Port of Newcastle, NSW Land Registry Services, Mexican Pipelines,
and Aligned Data Centres.
Private Equity
-
Partners Group Global Value Fund added +1.8% for the three months ending August 2025. During the period, mature portfolio assets drove positive gains. Vermaat, the Dutch market leader in premium catering and hospitality services, recorded an increased valuation in July 2025, driven by the EUR 1.5 billion (enterprise value) sale of the company to Compass Group. Additionally, the fund benefitted from positive revaluations from secondary investments. Overall, the fund’s exit pipeline remains robust with an increasing number of mature assets, positioning it well to capitalize on opportunities in current market conditions.
-
Hamilton Lane Private Assets Fund (Unhedged) returned -0.3% for the three months ending August 2025. Across the period, direct equity and single-asset secondary investments drove positive returns. One of the largest positive contributors to the performance was the fund’s investment in Solenis, a Western Europe Direct Equity investment. Solenis represents a strategic investment in a global supplier of water treatment and process chemicals, serving essential industries such as pulp and paper, oil and gas, chemical processing, and mining.
Private Debt
-
West Street European Private Credit Fund returned +1.8% for the three months ending August 2025. Underlying loan income performed strongly across the period, with the fund invested predominantly in first lien loans that are floating rate and directly originated. The portfolio currently comprises exposure to eleven sub-sectors across thirteen countries. During the period, the fund’s largest deal completed in July 2025 an investment in Trade Me which is one of New Zealand’s largest private companies, a leading operator of online classifieds platform.
-
Partners Group Global Income Fund returned +2.0% for the three months ending August 2025, primarily driven by interest income. Sector wise, Information Technology, Health Care and Consumer Discretionary were the best performers. During the period, the fund continued to incorporate new direct credit positions into the portfolio. Notable additions include a well-established Dutch accounting and advisory firm, one of the fastest-growing dental management companies in the United States, and a European leader in testing, inspection, certification, and compliance services. The portfolio is diversified globally and invested across fifteen sub-sectors.
-
Merricks Partners added +2.1% for the three months ending August 2025. In Australia and New Zealand, the current interest easing cycle is helping long-duration real assets and valuations. There were no major portfolio changes during the period however, a recent major milestone for the Pitt & Hunter project. Cbus Property’s agreement to acquire a 50% stake in the project and committing to fully fund excavation and construction without requiring pre-leasing provides significant institutional backing . Within agriculture, improved seasonal conditions combined with favourable commodity pricing and strong trade demand, is strengthening working capital positions across the fund’s agriculture exposure.
Hedge Funds
-
L1 Capital Long Short returned +13.40% (Daily class) for the three months ending August 2025 with a large number of stocks delivering positive returns. The portfolio benefitted from exposure to gold and copper, as commodity prices moved higher. The fund’s gold positions were particularly strong driven by positive Q1 earnings results in the early part of the period. Long positions in Mineral Resources, Fraport, CRH and Qantas were notable strong contributors across the period.
-
Equity long short manager Munro Global Growth returned +4.9% for the three months ending September 2025. The fund’s long positions drove positive performance and benefitted from strong corporate earnings and continued momentum in AI development. Key contributors to performance for the quarter included CATL, Oracle, TSMC and NVIDIA.
-
Tiger Global Investments added 7.4% over the three months ending August 2025 driven by gains in the long book. Positions in high-growth businesses in consumer internet (Sea Limited, Meta), semiconductor companies (TSMC, Nvidia) were additive along with non-technology holdings in the European aerospace and defence sector (Airbus, Safran, Rolls-Royce). Gains were also made in the private’s allocation following valuation uplifts to select positions.
Venture Capital
-
StepStone Private Venture and Growth Fund (SPRING) added +2.4% for the three months ending August 2025. Performance was driven by unrealised gains from the mark-up of companies that have recently completed new rounds of financing and unrealised gains associated with GP fair value updates. SPRING initially invested in SpaceX January 2024. As of May 2025, SPRING had completed six follow-on investments in SpaceX via direct secondary purchases, SPVs and continuation funds. Since SPRING’s initial investment, SpaceX has announced two additional tender offers, with the latest valuing the company at circa $400 billion.
-