-
Q2 in review
The second quarter was defined by shifting policy risks and significant market volatility.
The Trump administration’s surprise “Liberation Day” tariff announcements triggered heavy selling before sentiment partially recovered following the 90-day pause announcement.
Trade truces with the UK and China and progress on budget reconciliation improved sentiment further, although Moody’s US debt downgrade highlighted ongoing fiscal challenges.
Geopolitical tensions in the Middle East flared briefly but then subsided, supporting a calmer end to the quarter for financial markets.
1. Liberté
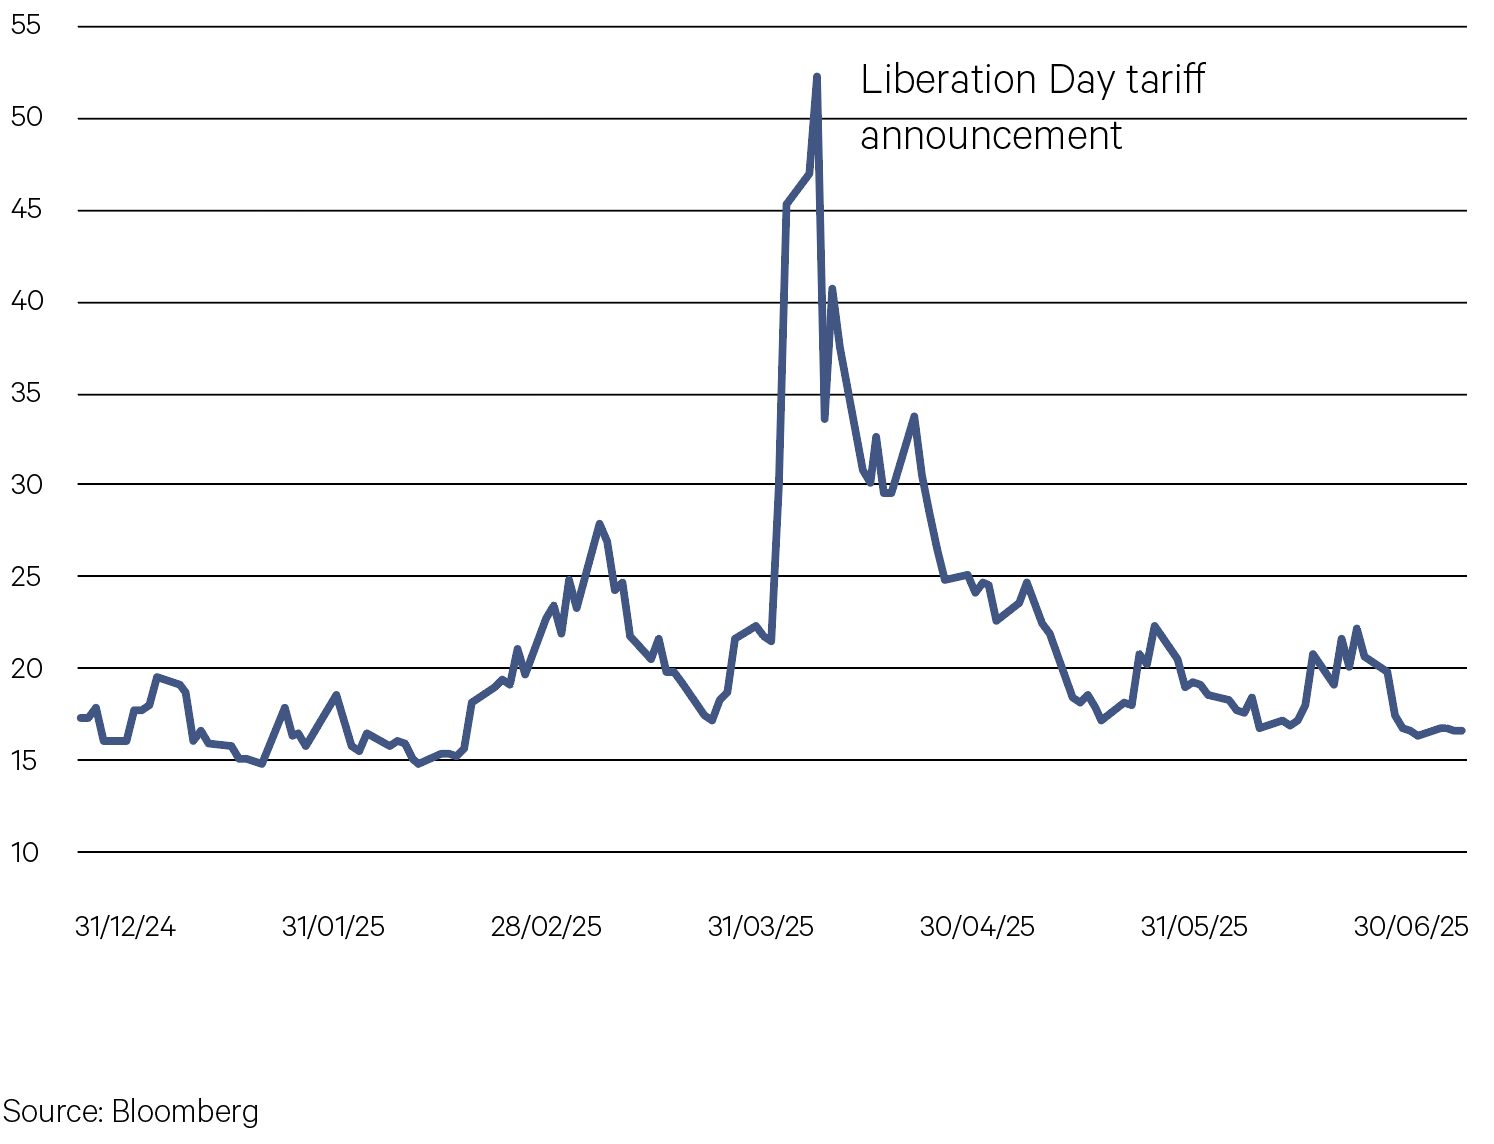
April was marked by extreme volatility in US equities, largely driven by the Trump administration’s surprise “Liberation Day” tariff announcements on April 2. Markets were already fragile after the worst first quarter for the S&P 500 Index since 2022. The new tariffs, with rates exceeding even the most pessimistic expectations, triggered a sharp wave of selling and shook investor confidence.
In the week following the announcement, the S&P 500 fell 11% and the VIX volatility index spiked above 50. This selloff pushed the index to the brink of bear market territory, down 19% from its February 19 peak. However, sentiment stabilized later in the month amid signs of possible tariff de-escalation and hopes for trade negotiations, leading to a partial recovery. By month-end, the S&P 500 had pared much of its losses to finish April down just 0.8%.
Chart 1: Market volatility spiked on the 2 April “Liberation Day” tariff announcement

2. Reconciliation
May brought a notable shift in market sentiment. The Trump administration announced trade truces with the UK and, more importantly, China. This helped to reduce the risk of further escalation and raised hopes for additional agreements in the coming months.
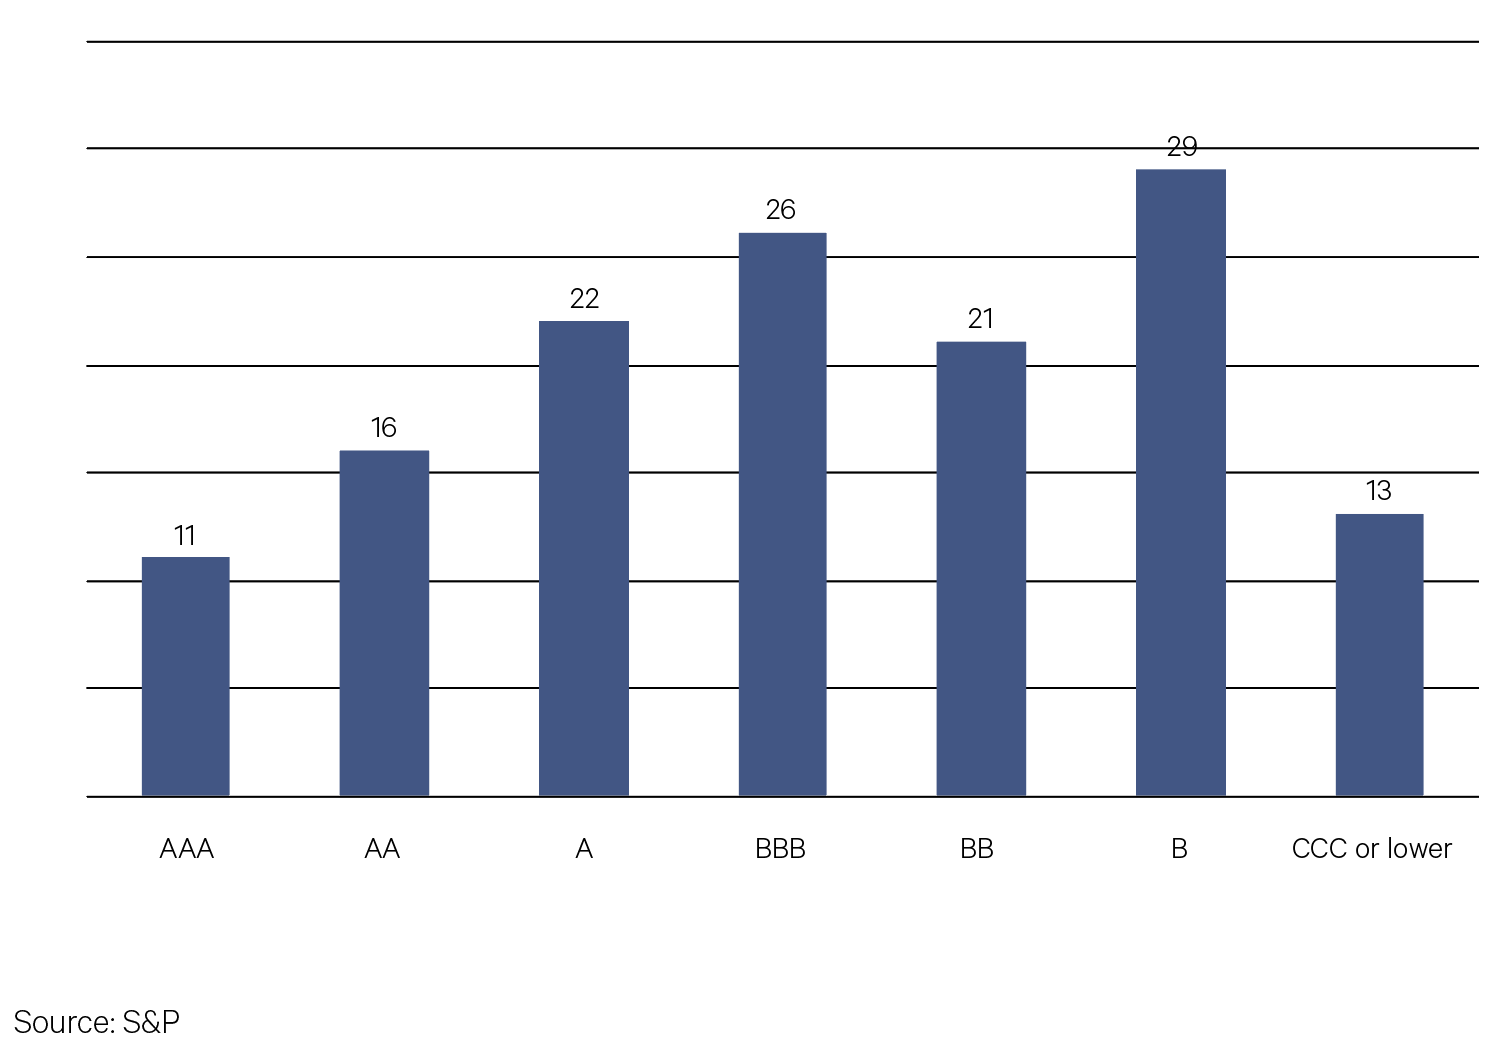
At the same time, progress on the budget reconciliation process became clearer as the bill advanced into the committee markup phase. However, not all news was positive. On May 16, Moody’s downgraded US debt, underscoring lingering fiscal concerns and serving as a reminder that risks remain even as near-term pressures have eased.
Chart 2: Distribution of sovereign ratings across 138 economies

3. De-escalation
Uncertainty around trade and fiscal policy eased in June. Supreme Court decisions did not appear to significantly alter the likelihood of the most economically damaging tariff scenarios, which were viewed as having become less likely as the month progressed. In June, markets also reacted to the outbreak (and subsequent easing) of tensions in the Middle East.
Overall, the reduction in uncertainty provided support to equity markets and saw bond yields, the US dollar and oil prices fall. The S&P 500 tends to deliver higher average returns after periods of high policy uncertainty. Resolution of policy uncertainty such as we saw in June typically reduces discount rates (yields fell in June) and improves confidence.
Chart 3: Markets price in bad news up front, setting the stage for better returns as uncertainty fades (returns after periods of policy uncertainty)

-
Australian Equities

While the IT sector was clearly the best performed in the June quarter, the gains only largely offset the DeepSeek-induced drawdown across February and March. While the exposure in the sector is small in the Australian index, these stocks have good representation across growth-orientated funds.
Another key growth sector is health care. While valuations in health care stocks have looked better on a relative basis, the index has lagged again in the first half of 2025, creating a headwind for this style of investing.
Chart 4: Diverging growth sectors in the Australian market

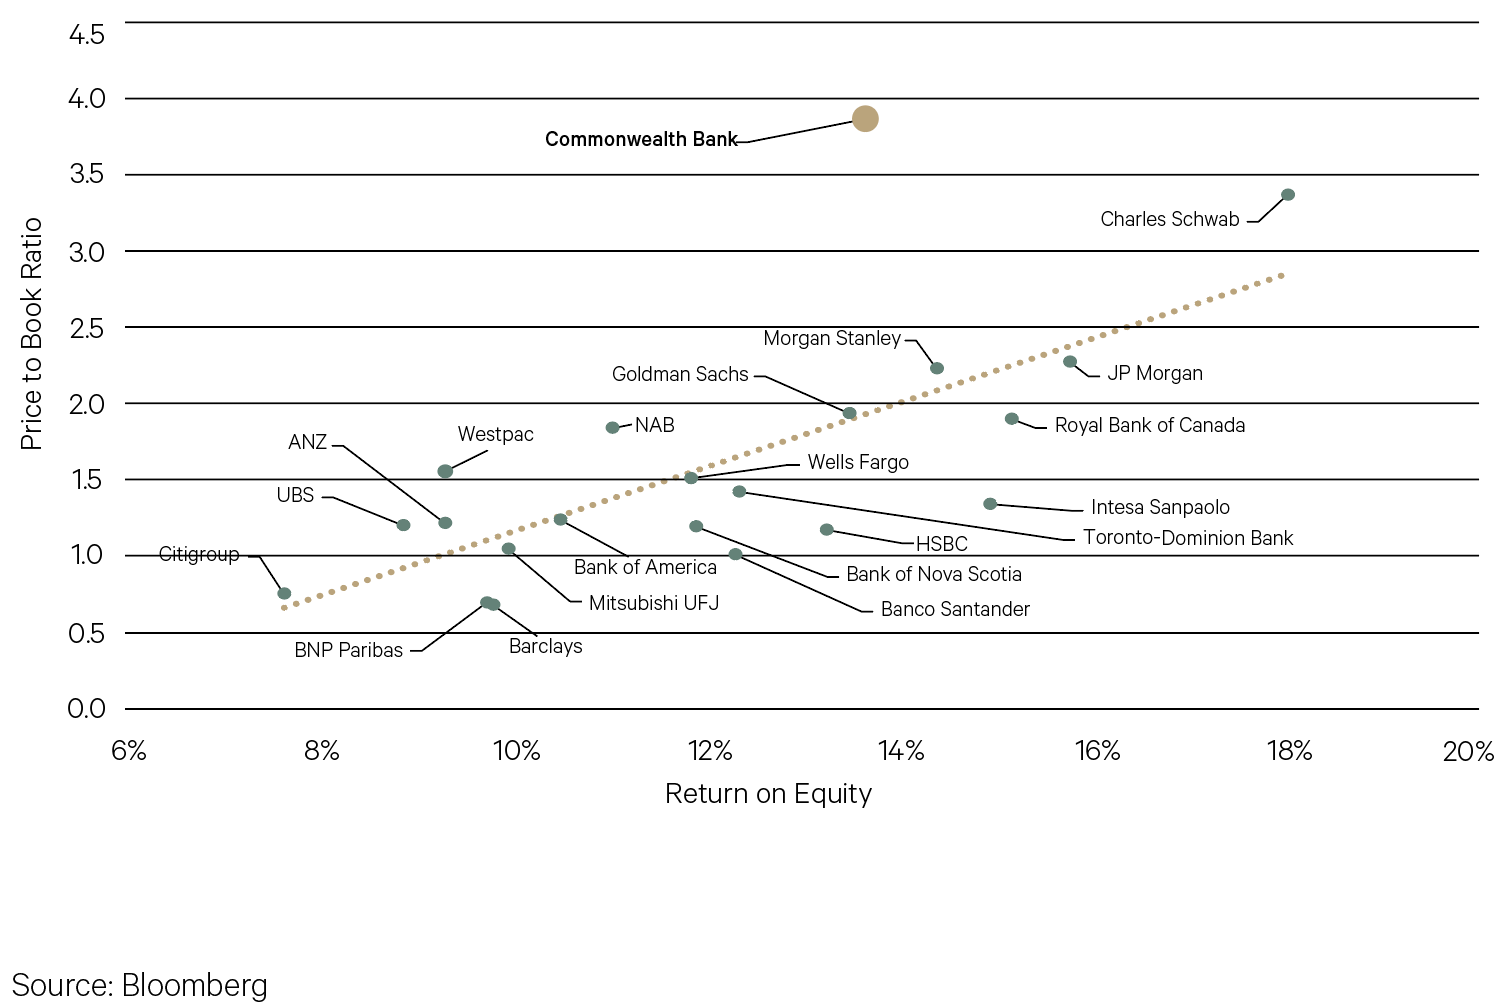
The relentless rise of Commonwealth Bank has continued to provide a challenge for Australian large cap active managers in the Australian market. The stock is now around 11.5% of the benchmark ASX 200 Index and was individually responsible for a quarter of the index’s rise in the last three months.
If we assess the relationship between price to book and return on equity, Commonwealth Bank is increasingly looking like an extreme outlier among the largest listed banks in the world. The stock now trades on a price to book ratio of almost 4x, almost twice that of what would be implied by this relationship.
Chart 5: CBA an outlier among global bank valuations


Key Points
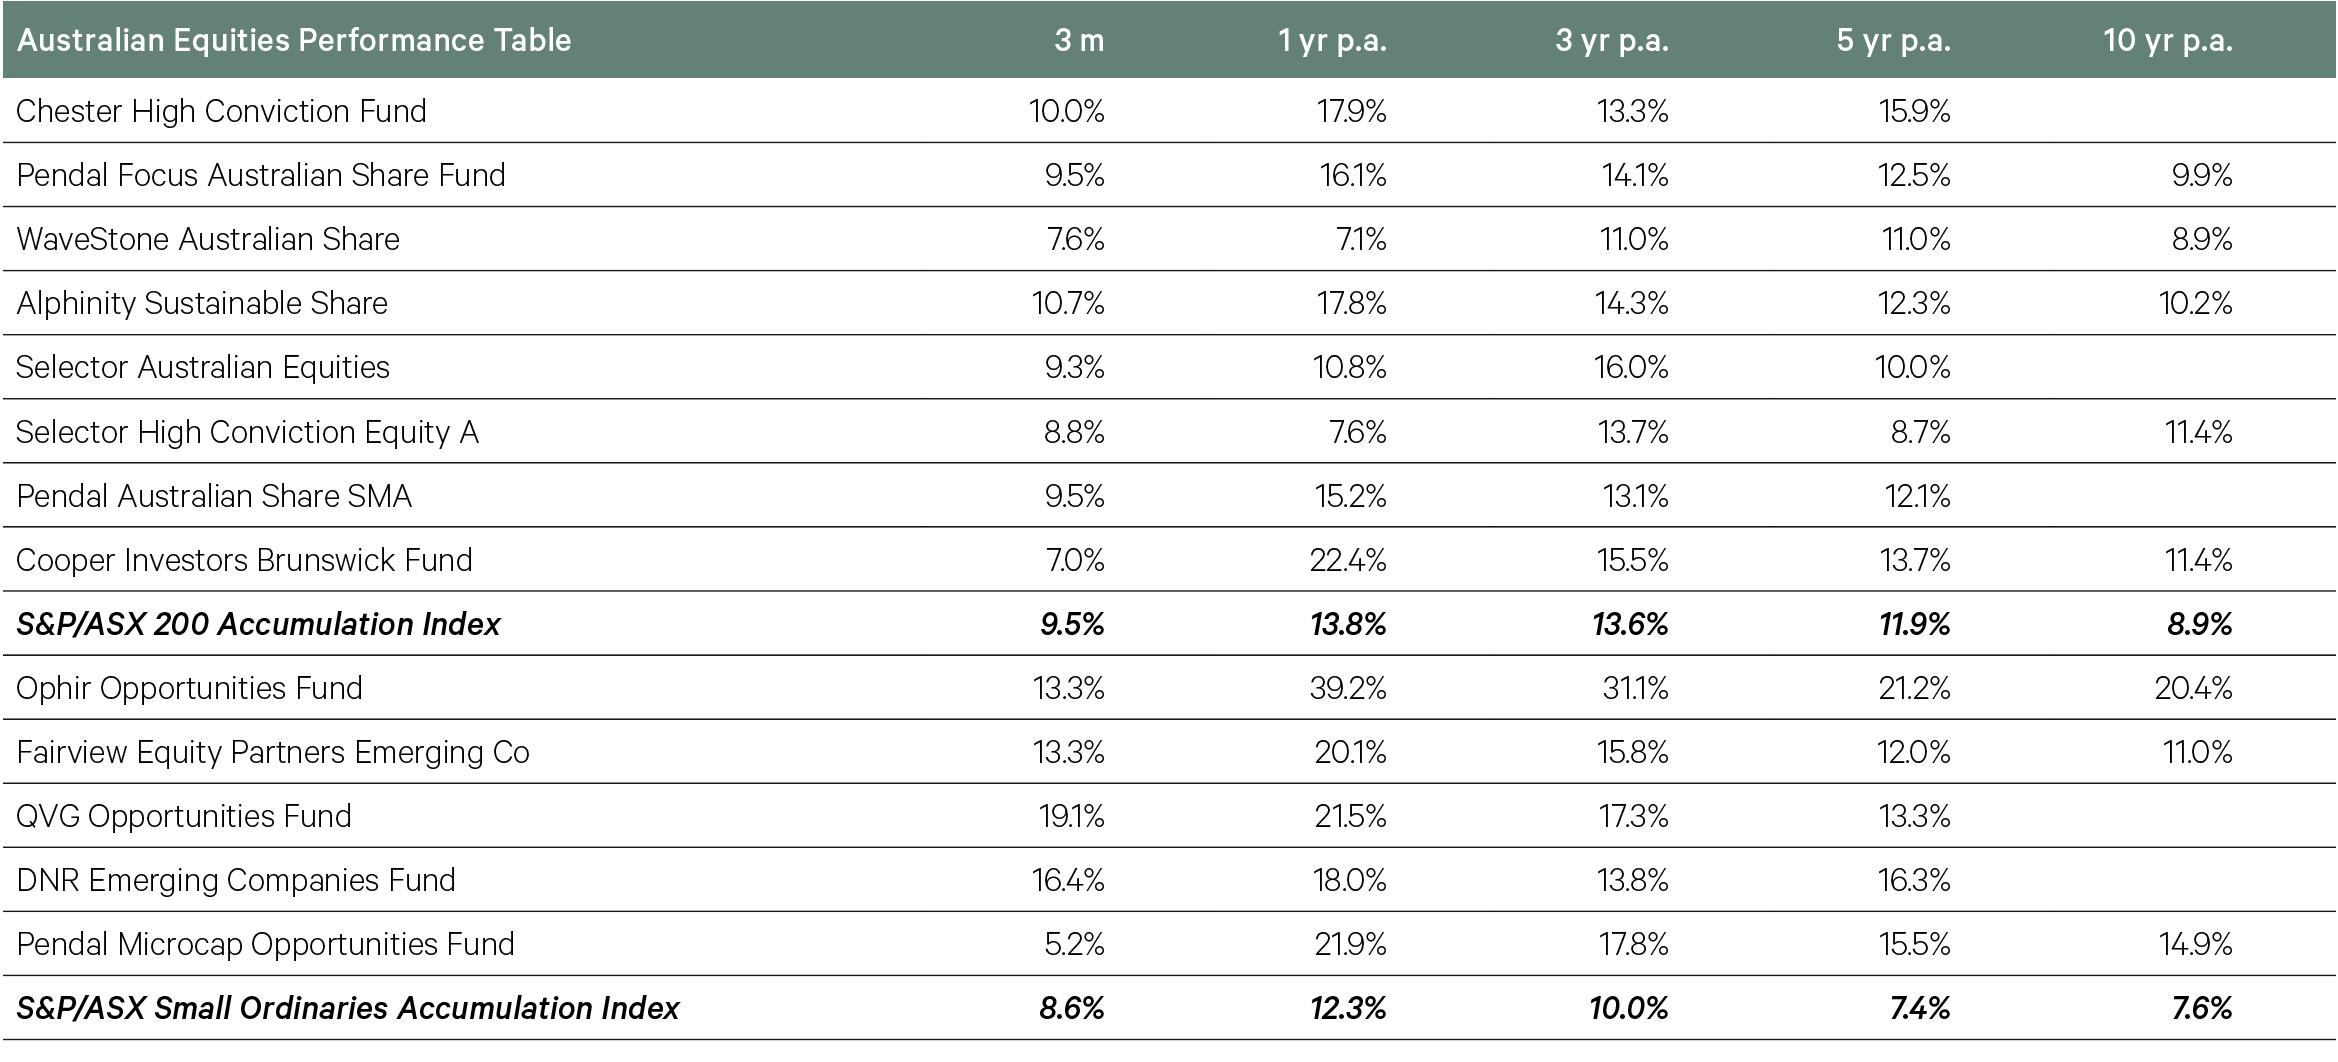
- The ASX 200 was among the best performed equity markets in the June quarter, advancing in each of the three months for a cumulative total return of 9.5%
- The quarter was marked, however, by considerable volatility driven by the changing landscape of US trade policy. In early April, the ASX 200 experienced an intra-month drawdown of 6% following the unveiling of the Trump administration’s ‘Liberation Day’ reciprocal tariffs. The market rallied as the proposed tariffs were paused the following week, with the momentum carrying into May and June.
- A positive driver for the market over the quarter was an easing in long bond yields alongside a further 25bp rate cut by the RBA in May. A further three rate cuts are now expected by the market over the course of 2025 with falling inflation providing the central bank additional scope to ease.
- Amid the volatility, the Australian market benefited from its perceived status as a safe haven destination for capital, with passive flows supporting gains among some of the biggest stocks in the index. This was again symbolised by a 22% gain in Commonwealth Bank, by far the largest weight in the benchmark index and a consensus underweight position among managers due to its elevated valuation.
- There was a wide dispersion in sector performance over the quarter. After falling sharply across February and March, the IT sector led all sectors with a 28% gain for the three months with significant gains in May, following the lead of a Nasdaq-led rebound. Growth-orientated managers, however, were hampered by softer performance across key stocks in the healthcare sector. The key drag on the index over the quarter was the mining sector as gold’s record run tapered and the iron ore price weakened.
- Among our large and mid cap managers, Alphinity Sustainable produced the strongest performance, with several IT stocks contributing to the fund’s returns. Despite typically exhibiting low beta to rising markets, the Chester High Conviction Fund also generated solid performance, in part driven by good stock picking in the resources sector.
- Small caps also generated strong returns over the quarter, though slightly lagged their larger cap counterparts. With the small cap index lifted higher by resources, particularly gold, in the March quarter, market leadership shifted towards growth-oriented industrial stocks in the June quarter.
- This rotation resulted in a sharp recovery in many funds that lagged in the first quarter of the year, with impressive alpha generated by QVG and DNR, while Fairview also delivered strong performance. Technology stocks, such as Life360, were a common source of attribution among these funds.
-
International Equities
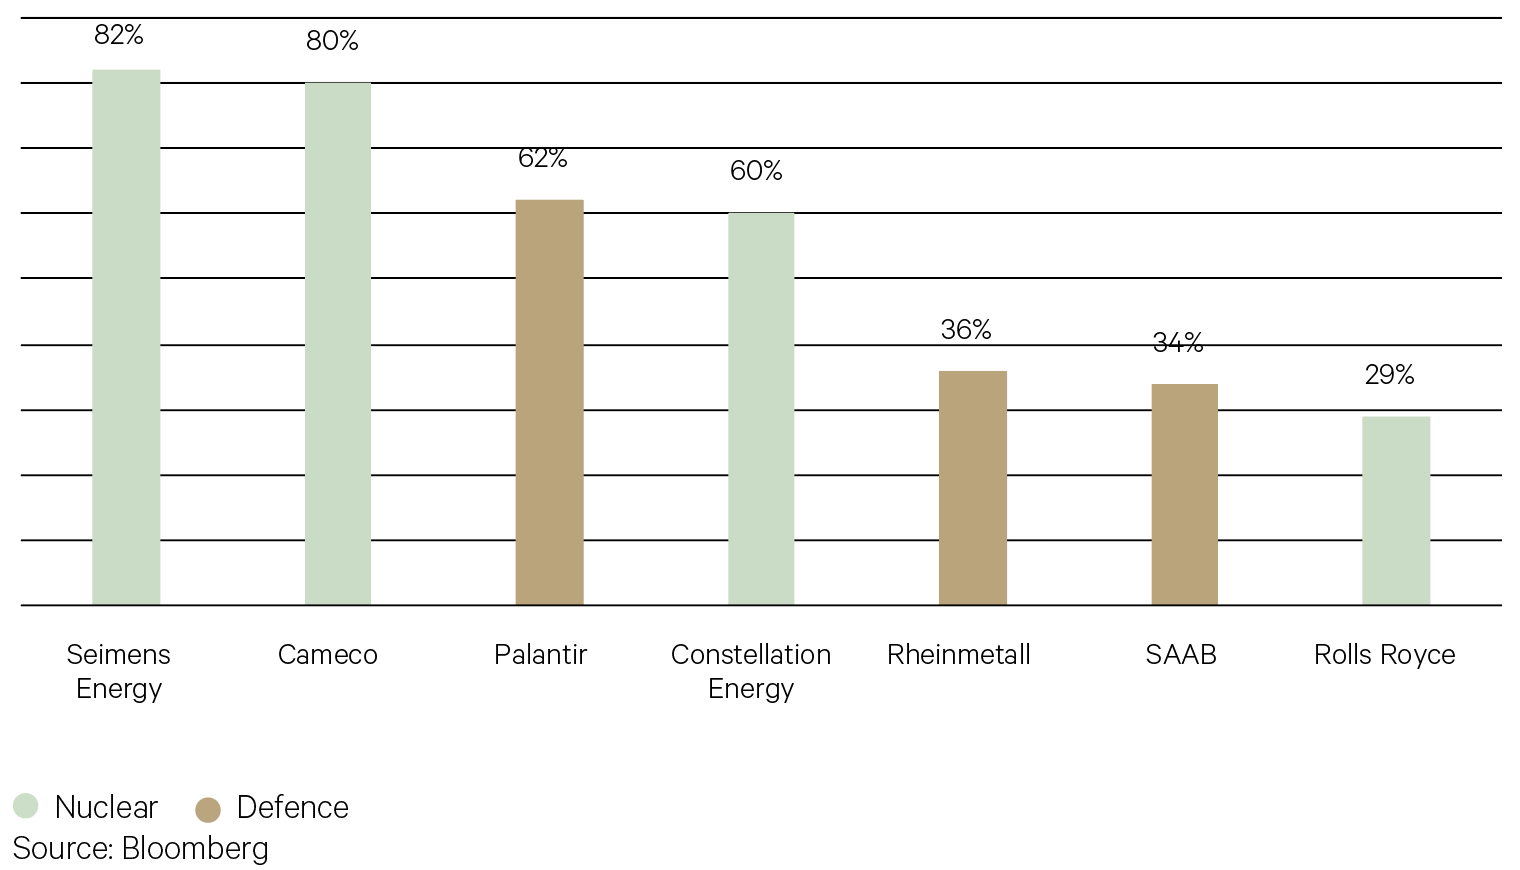
Nuclear energy companies are benefiting not only from the pledge by the Trump administration to quadruple the US fleet of reactors by 2050 but also by the surge in demand elsewhere for nuclear energy.
Nuclear energy is gaining popularity around the world, as countries look to decarbonise their electricity systems and reduce their reliance on volatile commodities like oil and natural gas. Even countries that had previously sworn off nuclear power, like Germany and Japan, are now embracing it.
Chart 6: Defence and nuclear names over the quarter

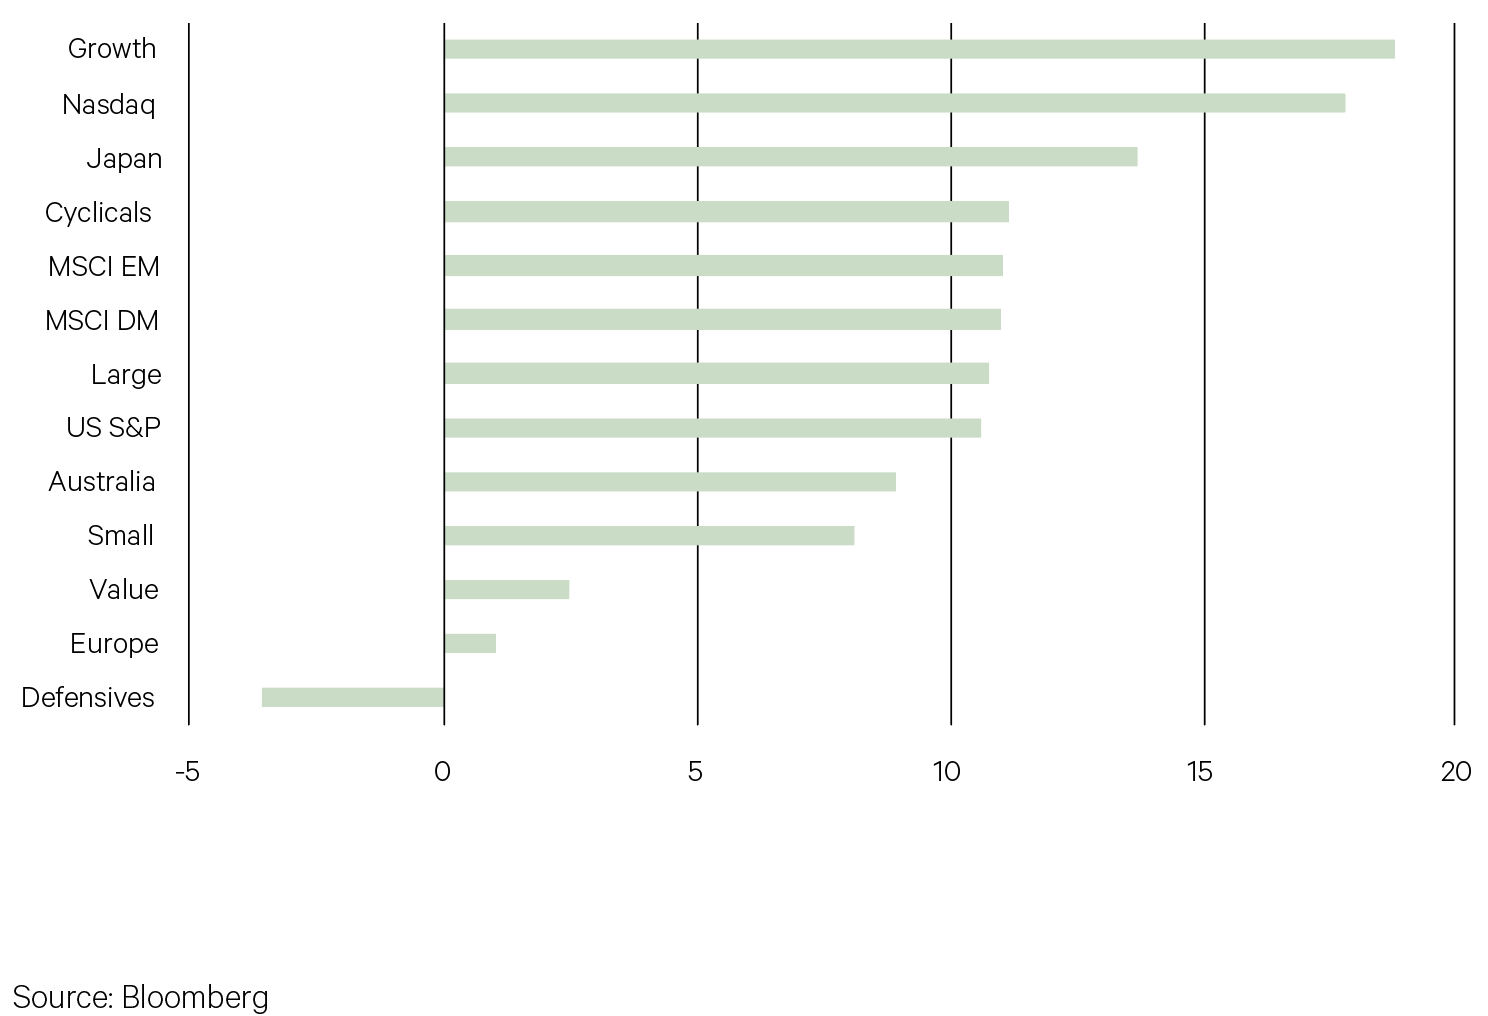
In contrast to the first quarter of 2025, cyclicals and growth stocks outperformed defensive and value stocks in Q2. A decline in bond yields provided some supported for the tech-heavy Nasdaq. Japan, being one of the most cyclical markets in the world, was a winner, while the value-oriented European market underperformed.
Chart 7: Equity market performance in Q2 2025 (%)


Key points
-
The MSCI World Index rose 11.0% in the quarter. US equities underperformed with the S&P500 rising by 10.6%, the best quarter since 2023 and follows the worst quarter since 2022. The Nasdaq finished up 18% for the quarter.
-
Japan and South Korean equities outperformed while the DAX rose by 7.9%. In contrast, the French CAC fell 1.6%. This level of dispersion between the DAX and CAC is unusual and points to the increasingly idiosyncratic nature of world markets.
-
The US Federal Reserve left interest rates unchanged at its most recent meeting in June seeing little urgency to lower interest rates anytime soon. New economic forecasts from the Federal Reserve show inflation accelerating, unemployment rising and growth turning more sluggish.
-
With the Australian dollar up by 5.3% against the US dollar, hedged international equities funds outperformed unhedged over the quarter. Performance for our infrastructure and property funds moderated on easing fears of inflation.
-
In a turnaround from Q1, cyclical sectors outperformed defensives. The most defensively positioned funds underperformed – GQG, Artisan and Clearbridge RARE Infrastructure. Some of GQG’s largest positions are in defensive stocks such as Procter & Gamble, Coca-Cola, and Colgate – all of which declined in the quarter. GQG’s allocation to consumer staples increased from 3.5% in the March quarter to 15.3% as at May. Helping performance was its holdings in communication services companies Netflix and Meta and tech companies TSMC and Microsoft.
-
The outperformance of tech companies in the quarter helped Loftus Peak but also Lifecycle which has a 25% allocation to the sector. The single largest holding in Lifecycle is Microsoft which rose by 33% in Q2.
-
Funds that have exposure to nuclear energy are benefiting from a boom in the industry following support from President Trump. Munro’s holding in Cameco, the uranium miner and nuclear tech company, jumped by 70% in Q2. Constellation Energy, a holding in Clearbridge RARE as well as Munro, rose 60%. And Siemens Energy, in WCM, rose 97%.
-
WCM was up 11.9% in the quarter helped by its positions in Siemens Energy, Nvidia and Rolls Royce.
-
-
Fixed Income
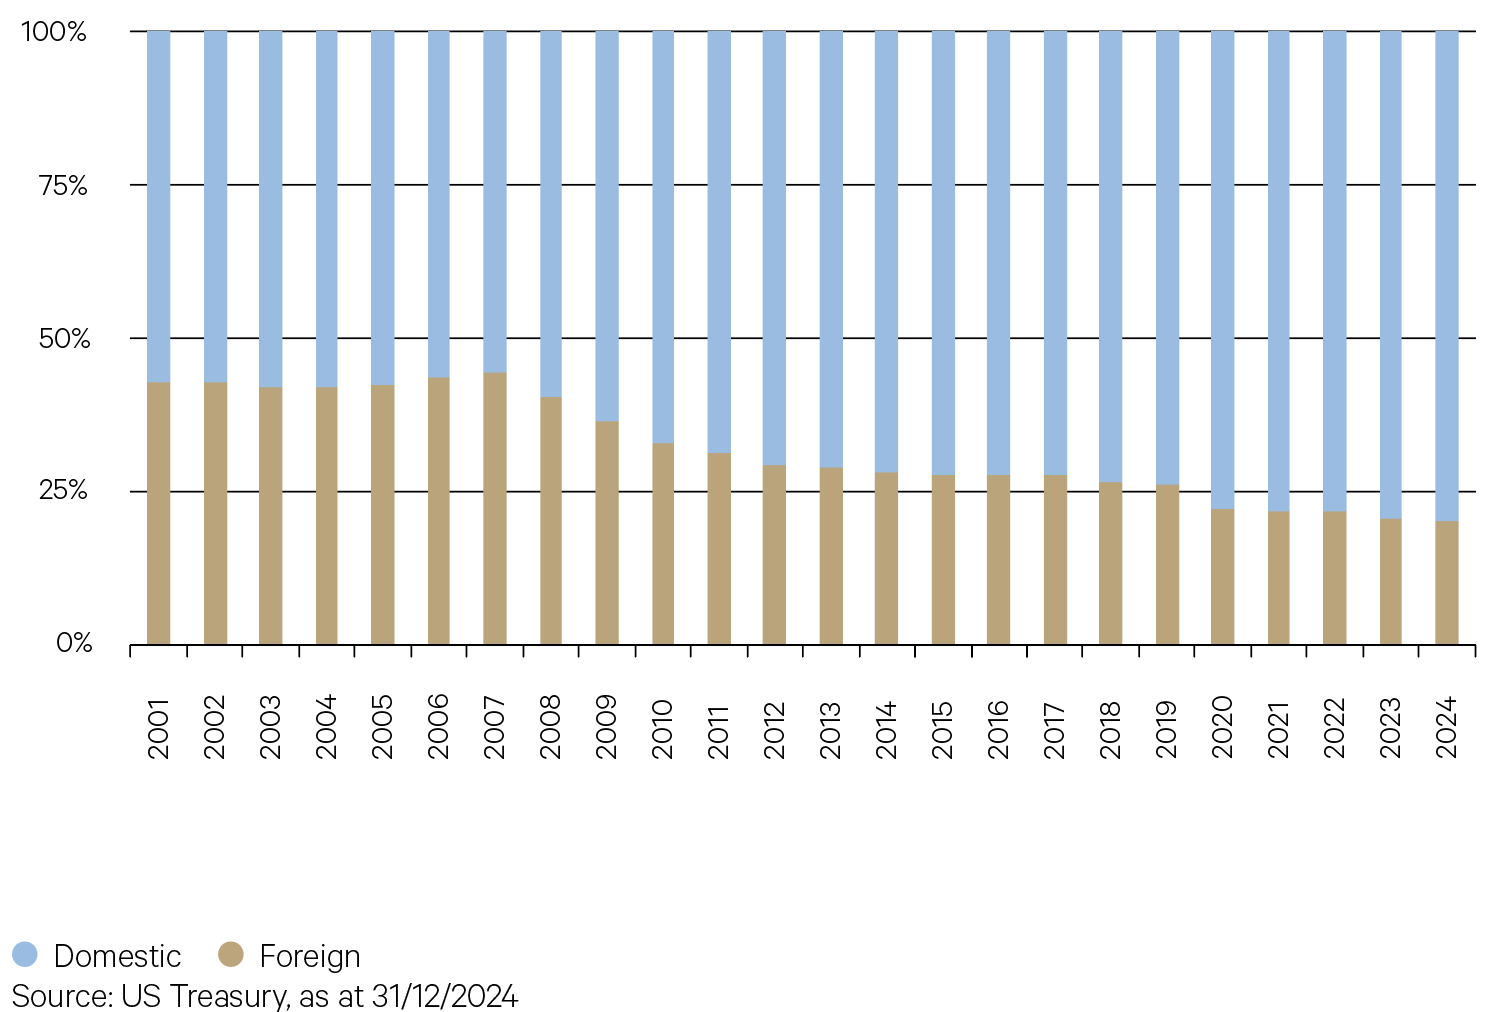
With US government debt now exceeding $36 trillion, foreign holdings of Treasuries now total over $9 trillion, a proportion that has been shrinking over the last 18 years. Japan is the largest offshore holder, accounting for over 12% of all foreign-owned Treasuries, followed by the UK and China.
Foreign demand for Treasuries helps reinforce the US dollar’s role as the world’s reserve currency and contributes to keeping interest rates lower, however as the US debt bill continues to grow, issuance is outpacing foreign demand.
Chart 8: Foreign-held share of all Treasuries declines

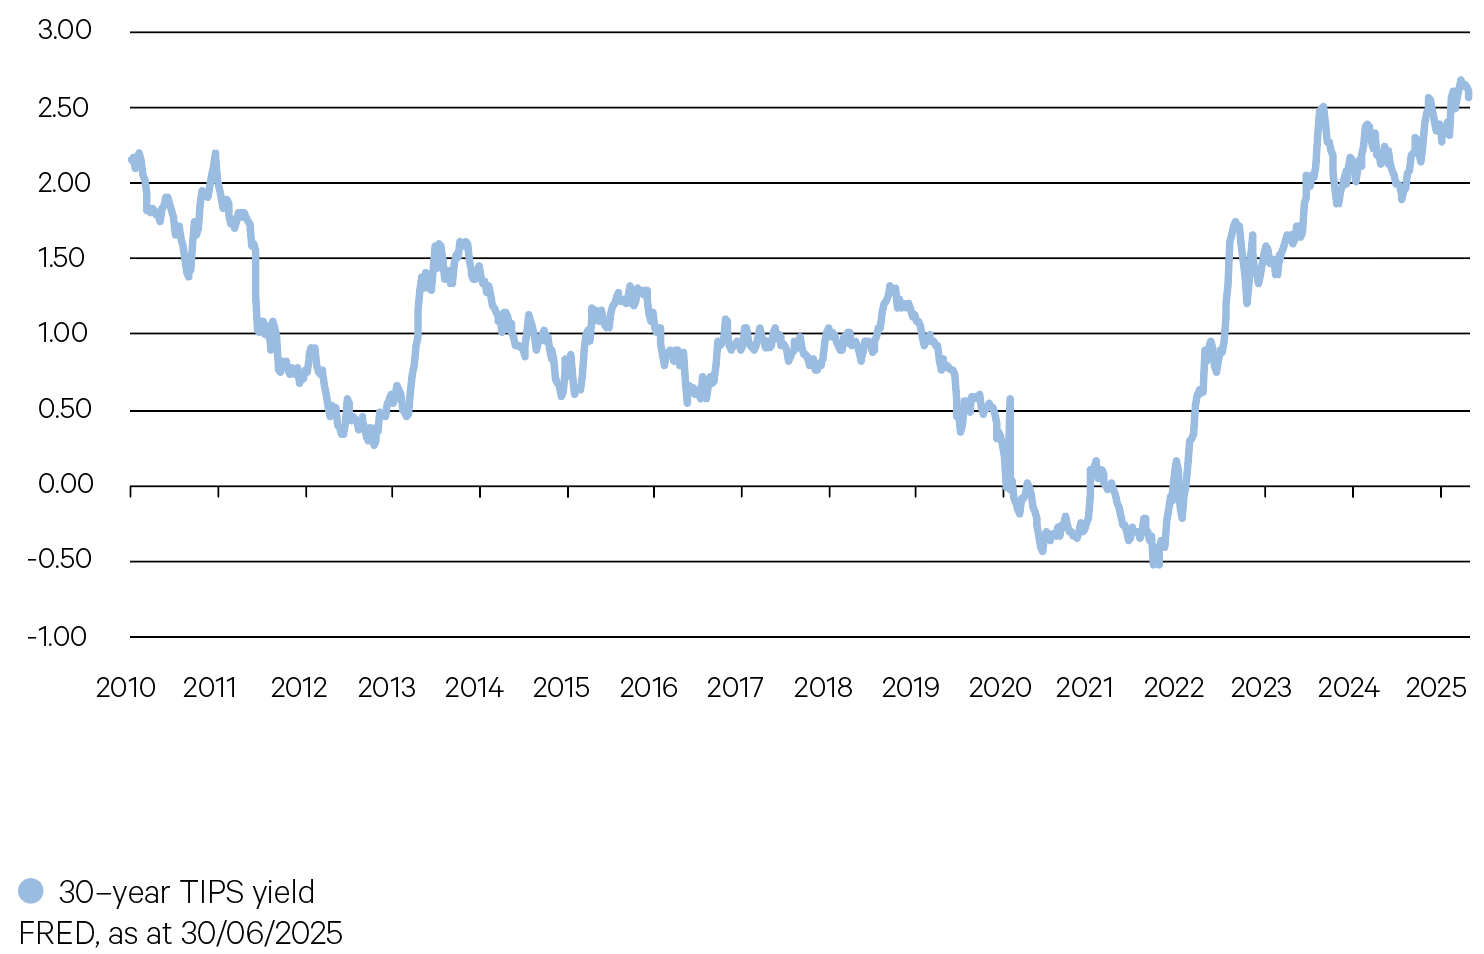
The yield on 30-year Treasury Inflation-Protected Securities (TIPS) has been climbing over the past three years to over 2.5%, the highest level in over 15 years.
TIPS remove inflation uncertainty, so that the long end of the yield curve primarily reflects investor uncertainty about future fiscal deficits.
As deficits continue to widen, markets are asking for more compensation to hold longer-dated securities, pushing real yields higher and steepening the curve at the long end.
Chart 9: Growing US fiscal deficit drives real yields higher (%)


Key points
-
Despite yield and spread volatility, fixed income markets ended the June quarter period near where they began, as the prospect of tariff-driven inflation and weaker growth created uncertainty for central banks worldwide.
-
In the US, the 10-year Treasury yield traded within a range of 3.99% to 4.60%, falling 10bps on the announcement of broad-based tariffs, before jumping sharply by nearly 19bps a few days later as trade tensions with China escalated.
-
The Treasury yield curve steepened, with the 2-year yield at 3.75% and the 30-year yield at 4.83% as of June 24. A weak Treasury auction in May pushed 20-year yields higher, creating a humped effect at the long end.
-
Trump’s “Big Beautiful Bill” progressed through Congress, promising tax cuts and a growing fiscal deficit over the next decade.
-
The Federal Reserve held rates steady in June, emphasising their “wait and see” approach in light of elevated policy uncertainty. Markets continued to price in two potential Federal Reserve rate cuts by year-end, while the Fed itself is projecting two or less cuts in the second half of the year.
-
The Reserve Bank made a “confident cut” of 25bps in May as inflation returned to the target range, with the minutes revealing consideration of a larger 50bps cut. The RBA is firmly in dovish territory, with markets pricing in at least 3 cuts in the second half of the year.
-
While elevated yield volatility impacted month-to-month performance, overall, duration sensitive funds benefitted from falling medium-term yields over
the quarter, with both PIMCO and Bentham focusing their exposure around the 5-year range. -
Our credit funds faced headwinds from widening spreads in the April Liberation Day sell-off, followed by a strong May performance as spreads retraced. Strong carry returns meant funds still performed well, despite spreads ending the quarter marginally wider.
-
Our liquidity bucket benefited from holding short-dated, highly liquid assets. Their low credit durations shielded them from the impact of widening credit spreads in April.
-
Overall, fixed income returns were supported by higher nominal yields, expectations of monetary easing, and resilient credit conditions.
-
-
Alternatives
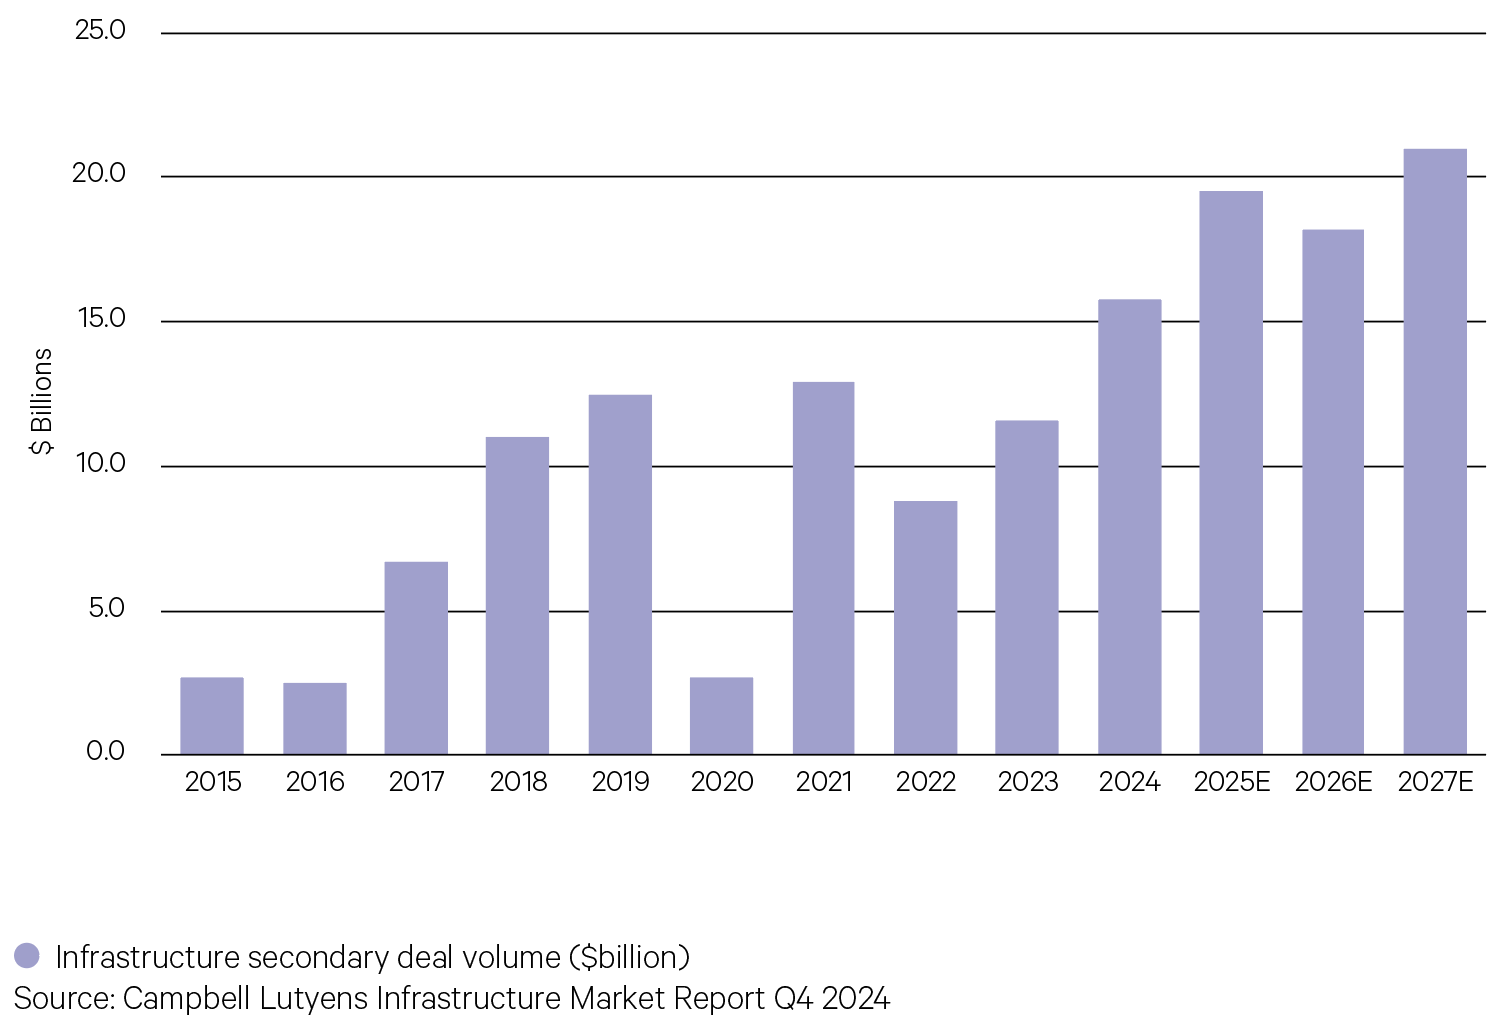
Liquidity pressures are driving significant activity in secondary markets across private equity, private credit, and infrastructure. Infrastructure secondaries are the fastest growing segment across the private markets. Infrastructure assets under management have risen from less than $400 billion a decade ago to more than $1.6 trillion.
2024 saw record infrastructure secondary market volume of circa $16 billion, with projections indicating further growth fuelled by recent market dislocations increasing the volume of traditional secondary purchases, as infrastructure’s low correlation with other asset classes make it an attractive investment during less certain times.
Chart 10: Infrastructure secondaries projected to grow

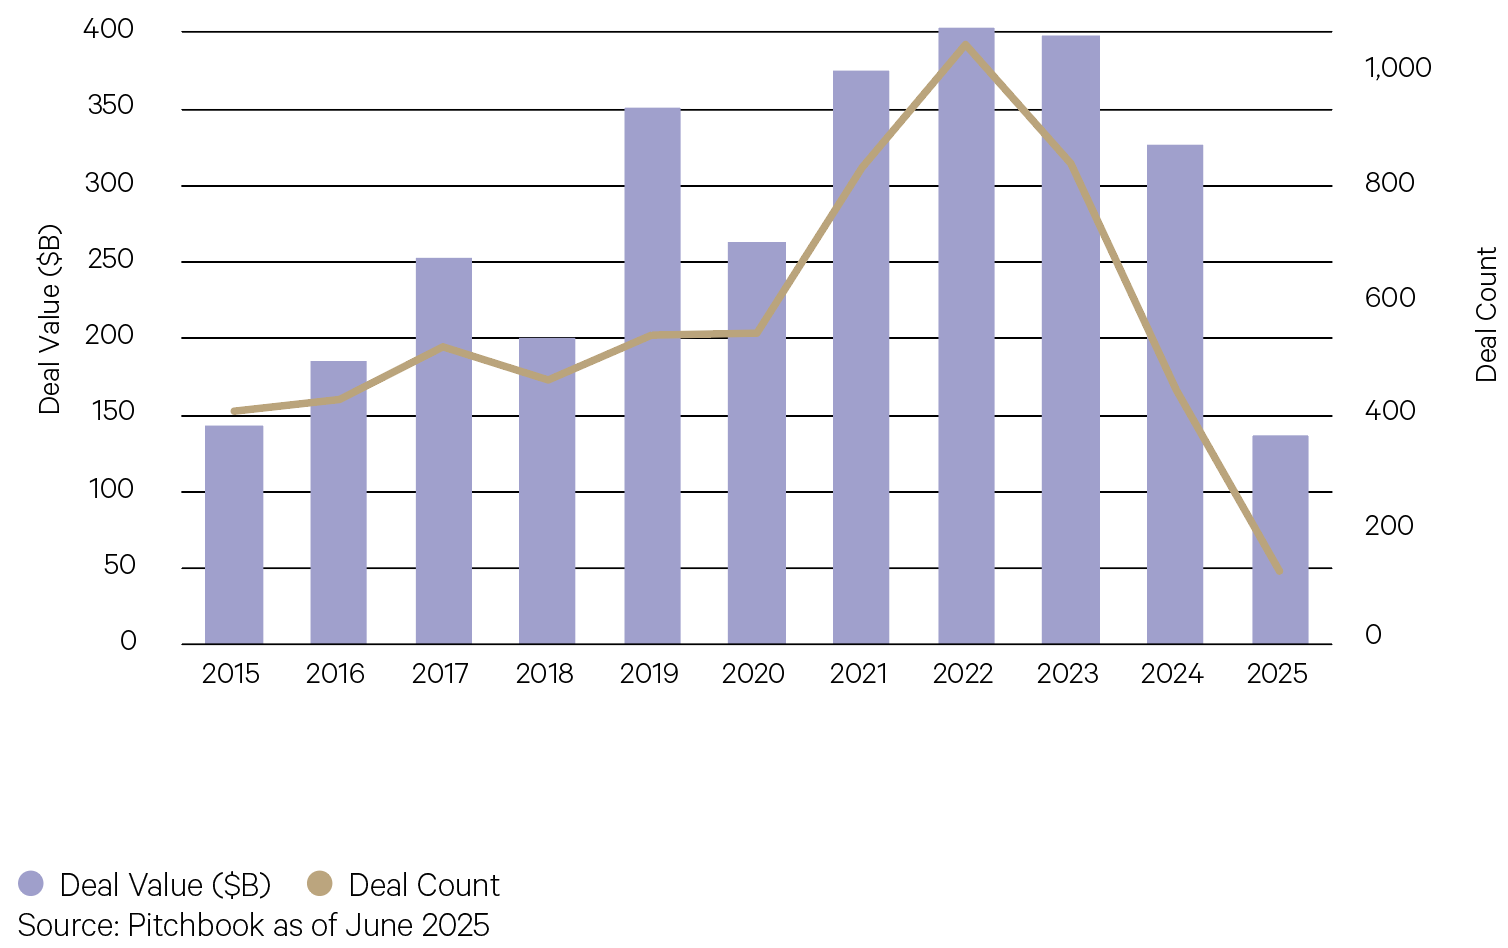
From 2020 to 2024, US private equity (PE) fundraising was strong despite many headwinds that negatively impacted other facets of the asset class, such as dealmaking and exit activity. During 2025, PE fundraising in the US has displayed a marked slowdown.
The broader market uncertainty seen since President Donald Trump’s “Liberation Day” in early April has likely acted as an additional headwind for the fundraising market, and halted exit activity that had begun to accelerate at the end of 2024. If clarity emerges on trade policy, macro conditions stabilise, and valuations improve, the likely result are positive tailwinds and increased PE exit activity going forward.
Chart 11: PE fundraising activity

Key points
Venture Capital
-
StepStone Private Venture and Growth Fund added +2.2% for the three months ending May 2025. Performance has continued to be driven by unrealised gains from the mark-up of companies that have recently completed new rounds of financing and unrealised gains associated with GP fair value updates. Glean, an enterprise AI startup, recently completed a US$150 million Series F funding round, elevating its valuation to US$7.2 billion. This funding follows a US$260 million Series E round in September 2024, which valued the company at US$4.6 billion, marking a significant increase in valuation within a short period.
Private Debt
-
West Street European Private Credit Fund returned 2.3% for the three months ending May 2025. Underlying loan income performed strongly across the period, with the fund invested predominantly in first lien loans that are floating rate and directly originated. The portfolio currently comprises exposure to eleven sub-sectors across twelve countries.
-
Partners Group Global Income Fund returned 1.2% for the three months ending May 2025. During the period, market movements in credit spreads translated into a mark to market impact on parts of the portfolio particularly in the syndicated loan exposure. The fund provides exposure to a highly diversified pool of global private debt investments in syndicated and direct credit which are first lien, senior secured floating rate loans. The portfolio is diversified globally and invested across fifteen sub-sectors.
-
Merricks Partners added +2.2% for the three months ending May 2025. The portfolio currently comprises senior secured loans diversified across fourteen sub-sectors and is additionally diversified by geographic spread and borrowers. The Manager continues to see a strong pipeline of opportunities, focusing on residential, agriculture, and specialised infrastructure assets.
Private Equity
-
Partners Group Global Value Fund was flat across the three months ending May 2025. Performance was impacted by the valuation of USD-denominated assets following the depreciation of the USD against the AUD during the period. This was partially offset by positive revaluation of direct and secondary private equity holdings. Notably, sectors such as Consumer Staples, Information Technology, and Communication Services contributed positively to overall performance.
-
Hamilton Lane Private Assets Fund (Unhedged) returned -0.1% for the three months ending May 2025. The depreciation of the USD dollar contributed downside returns across the period. One of the largest positive contributors to the performance this period was Flagstone, a direct equity buyout deal in Western Europe. The company has experienced strong organic growth increasing both its revenue and EBITDA across market environments. Another contributor to the performance this month was the fund’s investment in Cohesity, a North American technology company focused on cloud-based data management and protection. This is a growth equity single-asset secondary deal.
Hedge Funds
-
L1 Capital Long Short returned +11.7% (Daily class) for the three months ending June 2025. The portfolio’s performance across the period was driven by a broad range of contributors across industrials, travel, energy and mid-cap gold stocks. The fund’s gold positions performed strongly driven by strong Q1 results, positive major project updates and growing investor confidence in sustainably higher gold prices amid macro/geopolitical volatility. Long positions in NexGen Energy, Hudbay Minerals and Qantas were notable strong contributors across the period.
-
Equity long short manager Munro Global Growth returned +16.1% for the three months ending June 2025. The fund’s long positions drove positive performance against the backdrop of a volatile market environment. Within the long book, a core position in Nvidia was a key contributor to performance, driven by renewed investor optimism around AI after delivering strong earnings. Constellation Energy rebounded strongly after announcing positive long-term power offtake discussions with data centre customers. GE Vernova was a strong performer after being awarded a US$14.2 billion order to provide new power generation and grid equipment.
Infrastructure
-
The Macquarie Private Infrastructure fund returned +1.88% over the March quarter. The fund benefitted from positive performance for the majority of its unlisted infrastructure investments, most notably its Americas and Australian assets. Listed infrastructure and FX were also positive contributors to performance. Queensland Airports Limited was a key contributor for the quarter, with the divestment reaching financial close in March 2025. Other positive contributors included NSW Land Registry Services in Australia and Aligned Data Centres in the US.
-