-
Election season
The June quarter was volatile with several key election results having an outsized impact on financial markets. The theme of bigger government is beginning to impact equities, particularly sectors at risk of nationalization, such as infrastructure, and those exposed to government sovereign risk, such as banks and financial institutions via holdings of government bonds.
1. Election super-cycle
It is an election super-cycle this year. No fewer than 57 state and federal elections have been held so far globally and already some key themes are emerging.
First, exit polls and polls in general, remain poor predictors of the outcome. This creates volatility in markets. The results of the Mexican and Indian elections were both surprising for opposite reasons. Sheinbaum’s victory in Mexico was expected but a near-super majority was not. In India, a very large Modi victory was expected and instead a modest majority was delivered. The equity market in both countries dropped 6% on the day of the results.
Second, there is a protest vote happening. People are feeling disenfranchised and disappointed with the state of their world and so are voting against the incumbents. We saw this in the EU Parliamentary elections where there was a swing to the right—a protest against the cost of going green given what is happening to energy prices in Europe since the war in Ukraine.
Third, Coalition governments are on the rise and with increasing polarisation, coalitions are getting more difficult to form. The Dutch Prime Minister was finally sworn in last month, almost eight months after his country’s election. Spain’s Premier Sanchez is governing with the support of seven different parties. And Olaf Scholz is heading up Germany’s first three-way coalition in more than half a century.
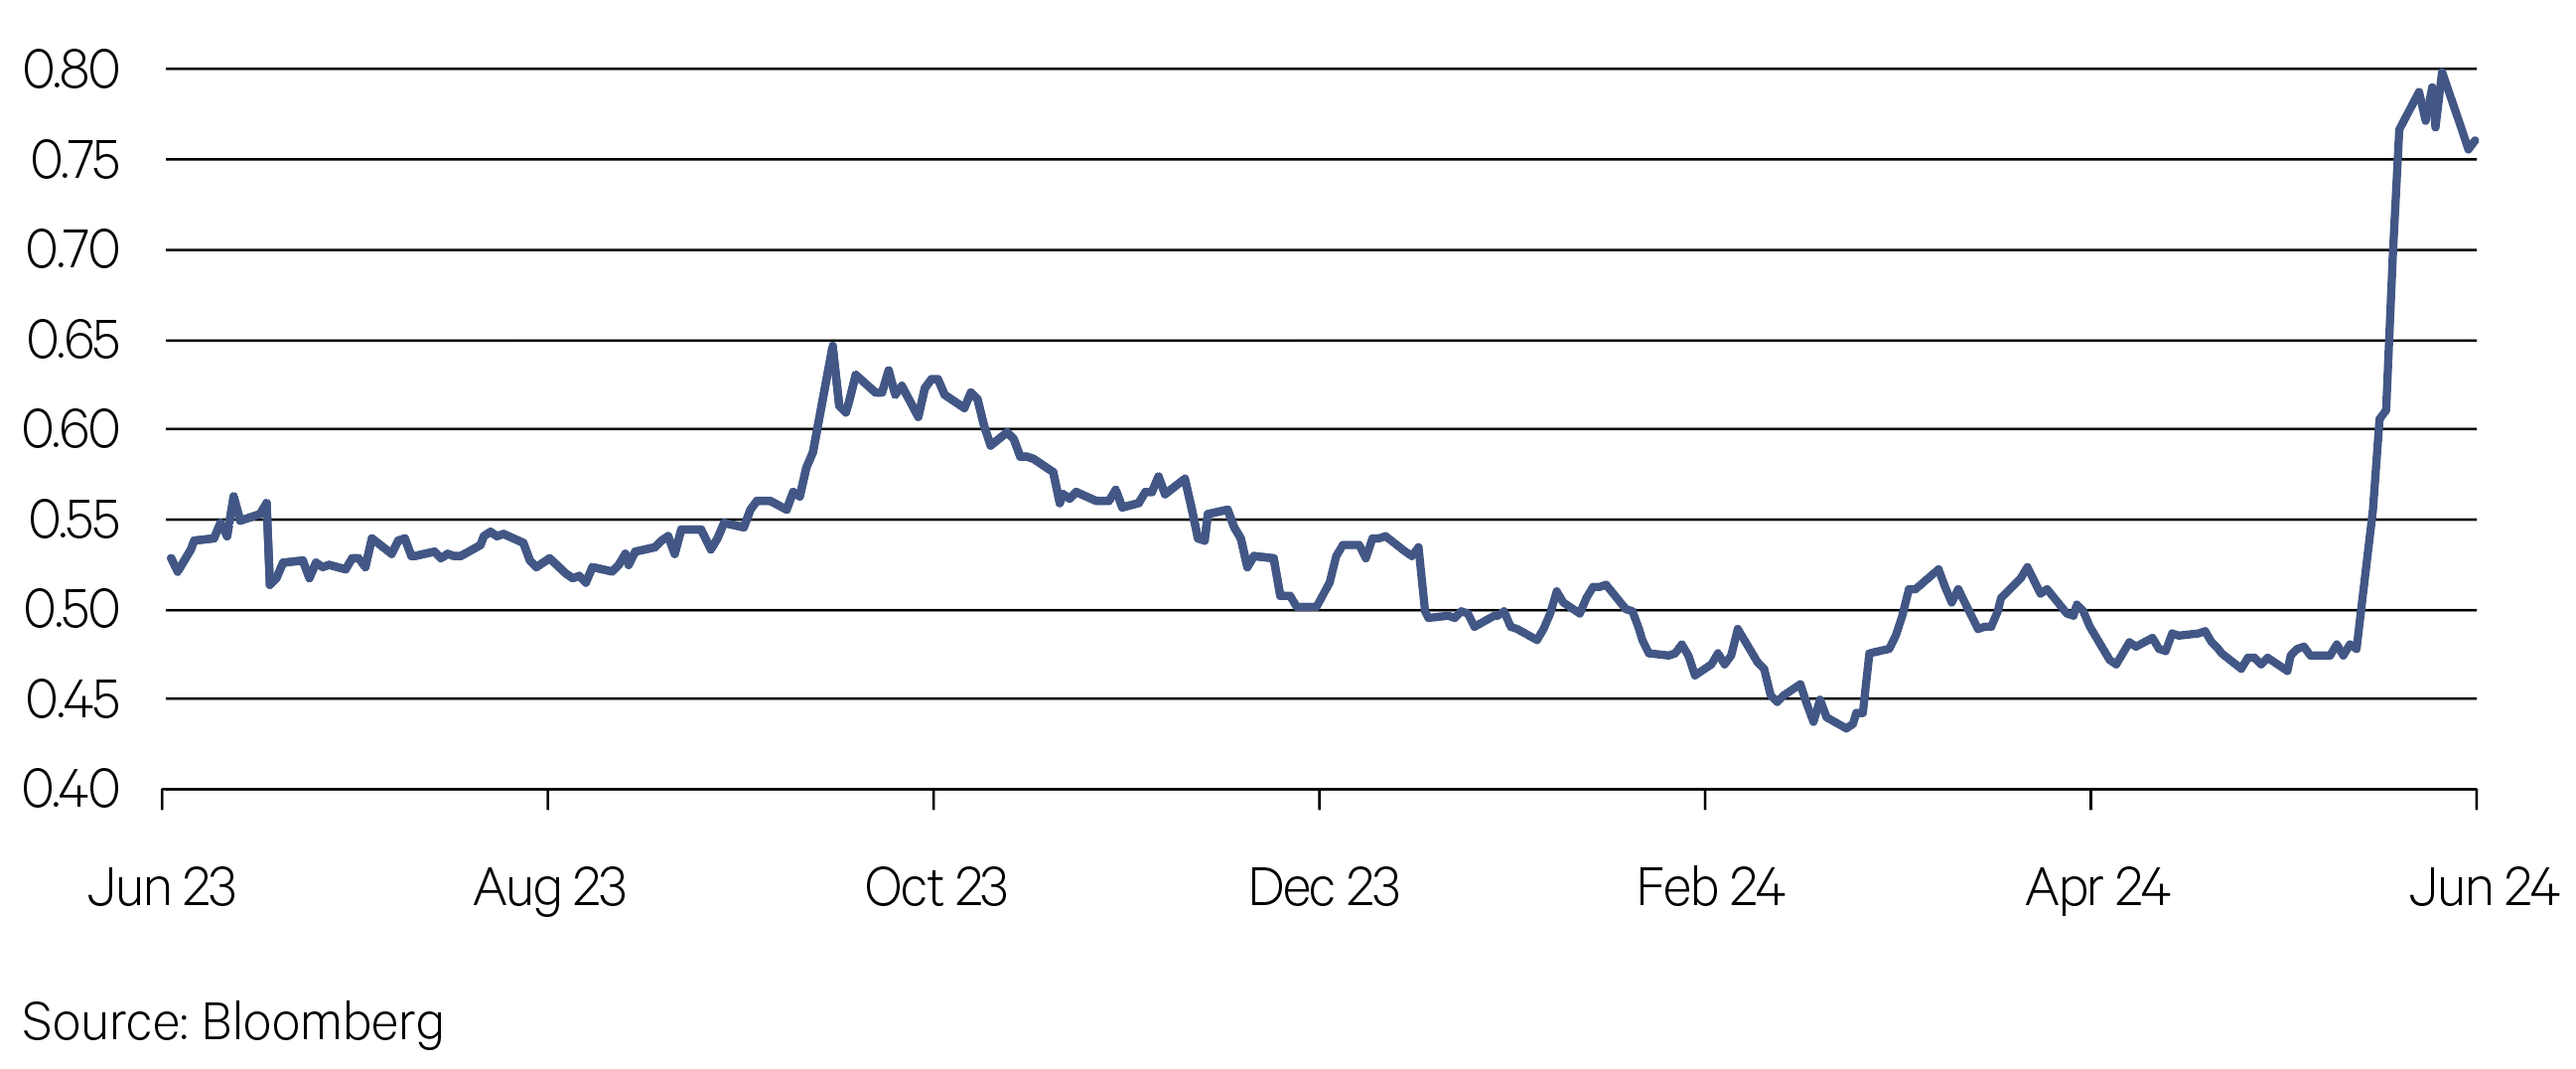
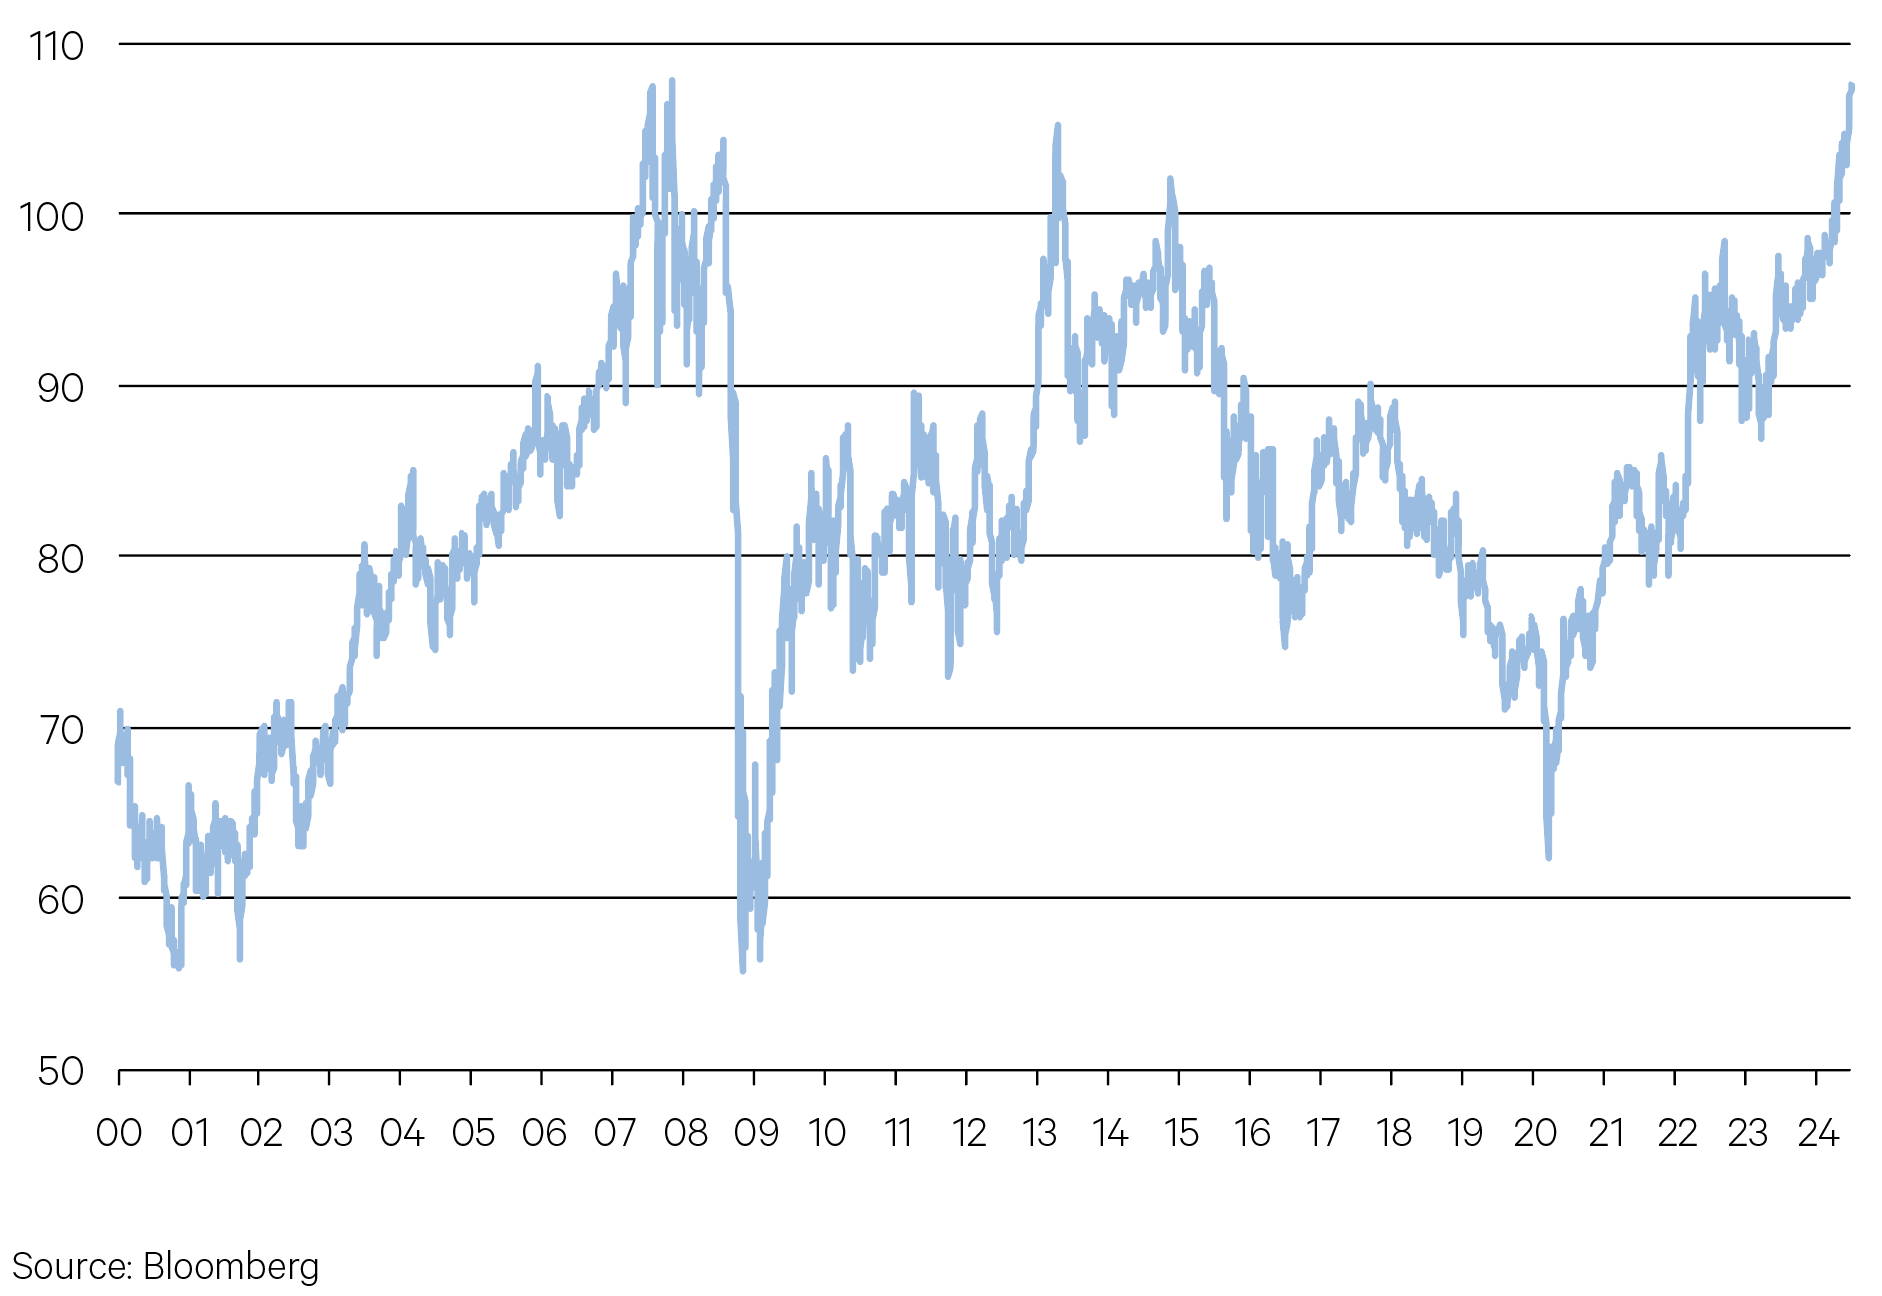
The implication is that idiosyncratic risk is rising. Government bond yields and currencies are the most sensitive to this. The spread, or the difference, between French and German 10-year bonds widened to its highest level in 12 years reflecting the increased risk of investing in France compared to Germany following the swing to the right in France.
Chart 1: Spread between French and German bond yields near 12-year highs (%)

2. Slowest easing cycle yet
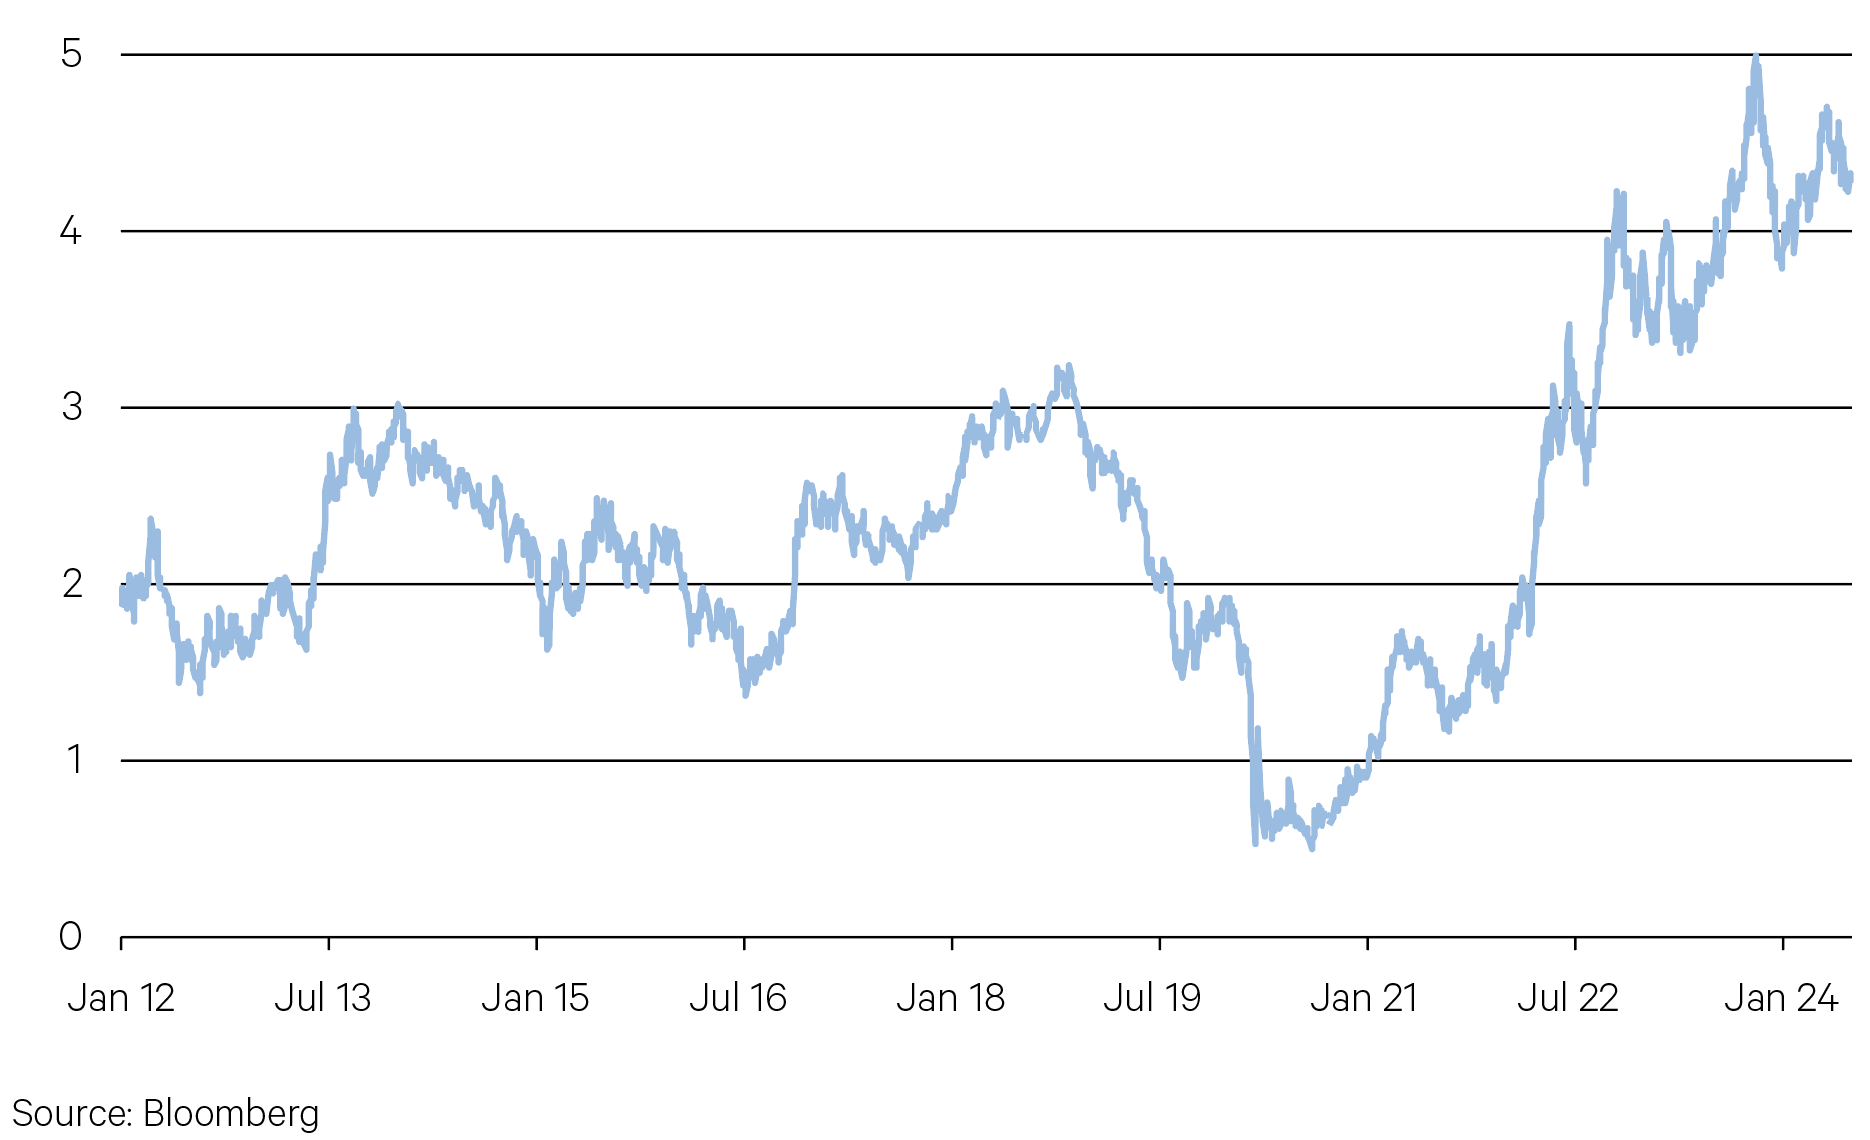
Yes, the global interest rate easing cycle has begun but don’t get too excited. We are unlikely to see too many interest rate cuts. In fact, this is likely to be one of the slowest easing cycles on record.
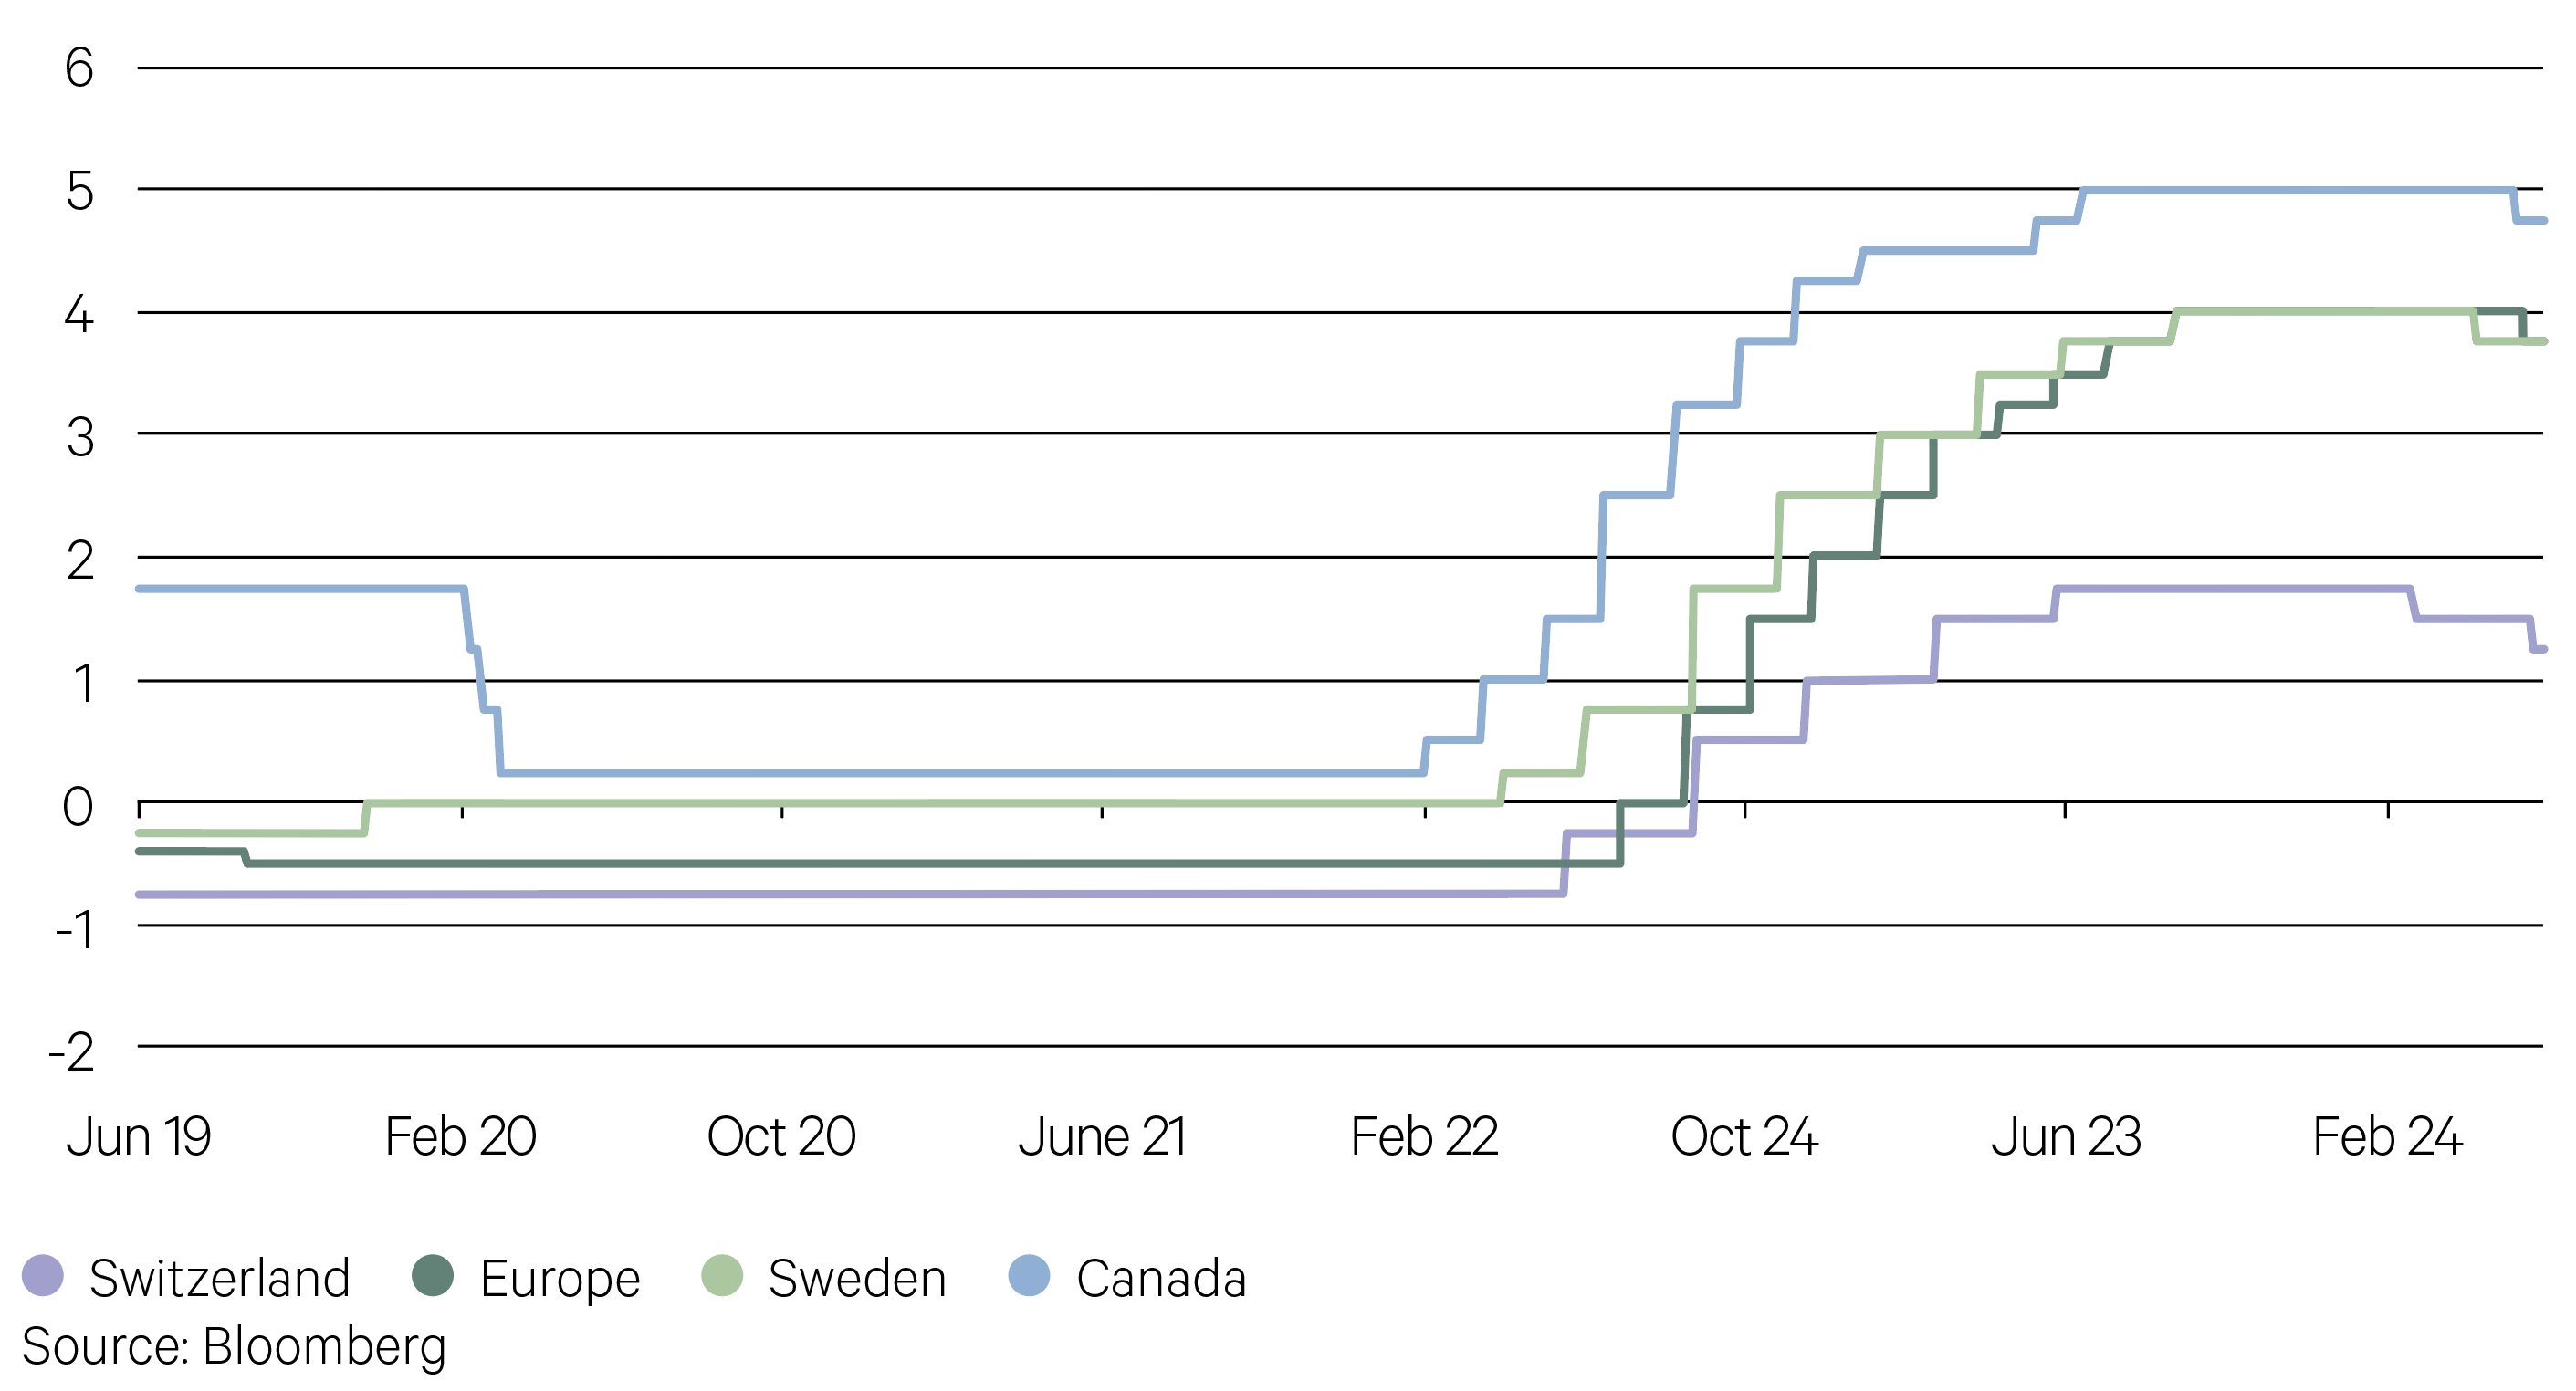
In June, the European Central Bank delivered its first rate cut since the pandemic, lowering its deposit rate by 25bps to 3.75%. The Bank of Canada also delivered its first rate cut of this cycle. Four of the G10 central banks have now cut rates this year (Sweden and Switzerland being the other two).
The UK is likely to be the next cab off the rank, possibly in August. The US will likely be after that leaving Australia to be one of the last central banks to cut interest rates.
One reason for why Australia will be a laggard is that we didn’t raise interest rates as much as they did in the US. And yes, our economy is only growing at 1.1% currently, but at least we are growing. The German and Japanese economies are shrinking. We are growing at twice the pace of Canada. Our core inflation rate is also higher than most of our peers. Bringing down an expansionary budget, on top of tax cuts from July 1 and a further lift in the minimum wage adds weight to why we will bring up the rear in this rate cutting cycle.
Chart 2: The easing cycle begins (%)

3. Rising protectionism
Countries are increasingly becoming insular—the global community is shrinking; we are in a multi-polar world and globalisation is in decline. Rather than trading with each other, we are putting up trade barriers; we are turning inward; we are re-industrialising our economies.
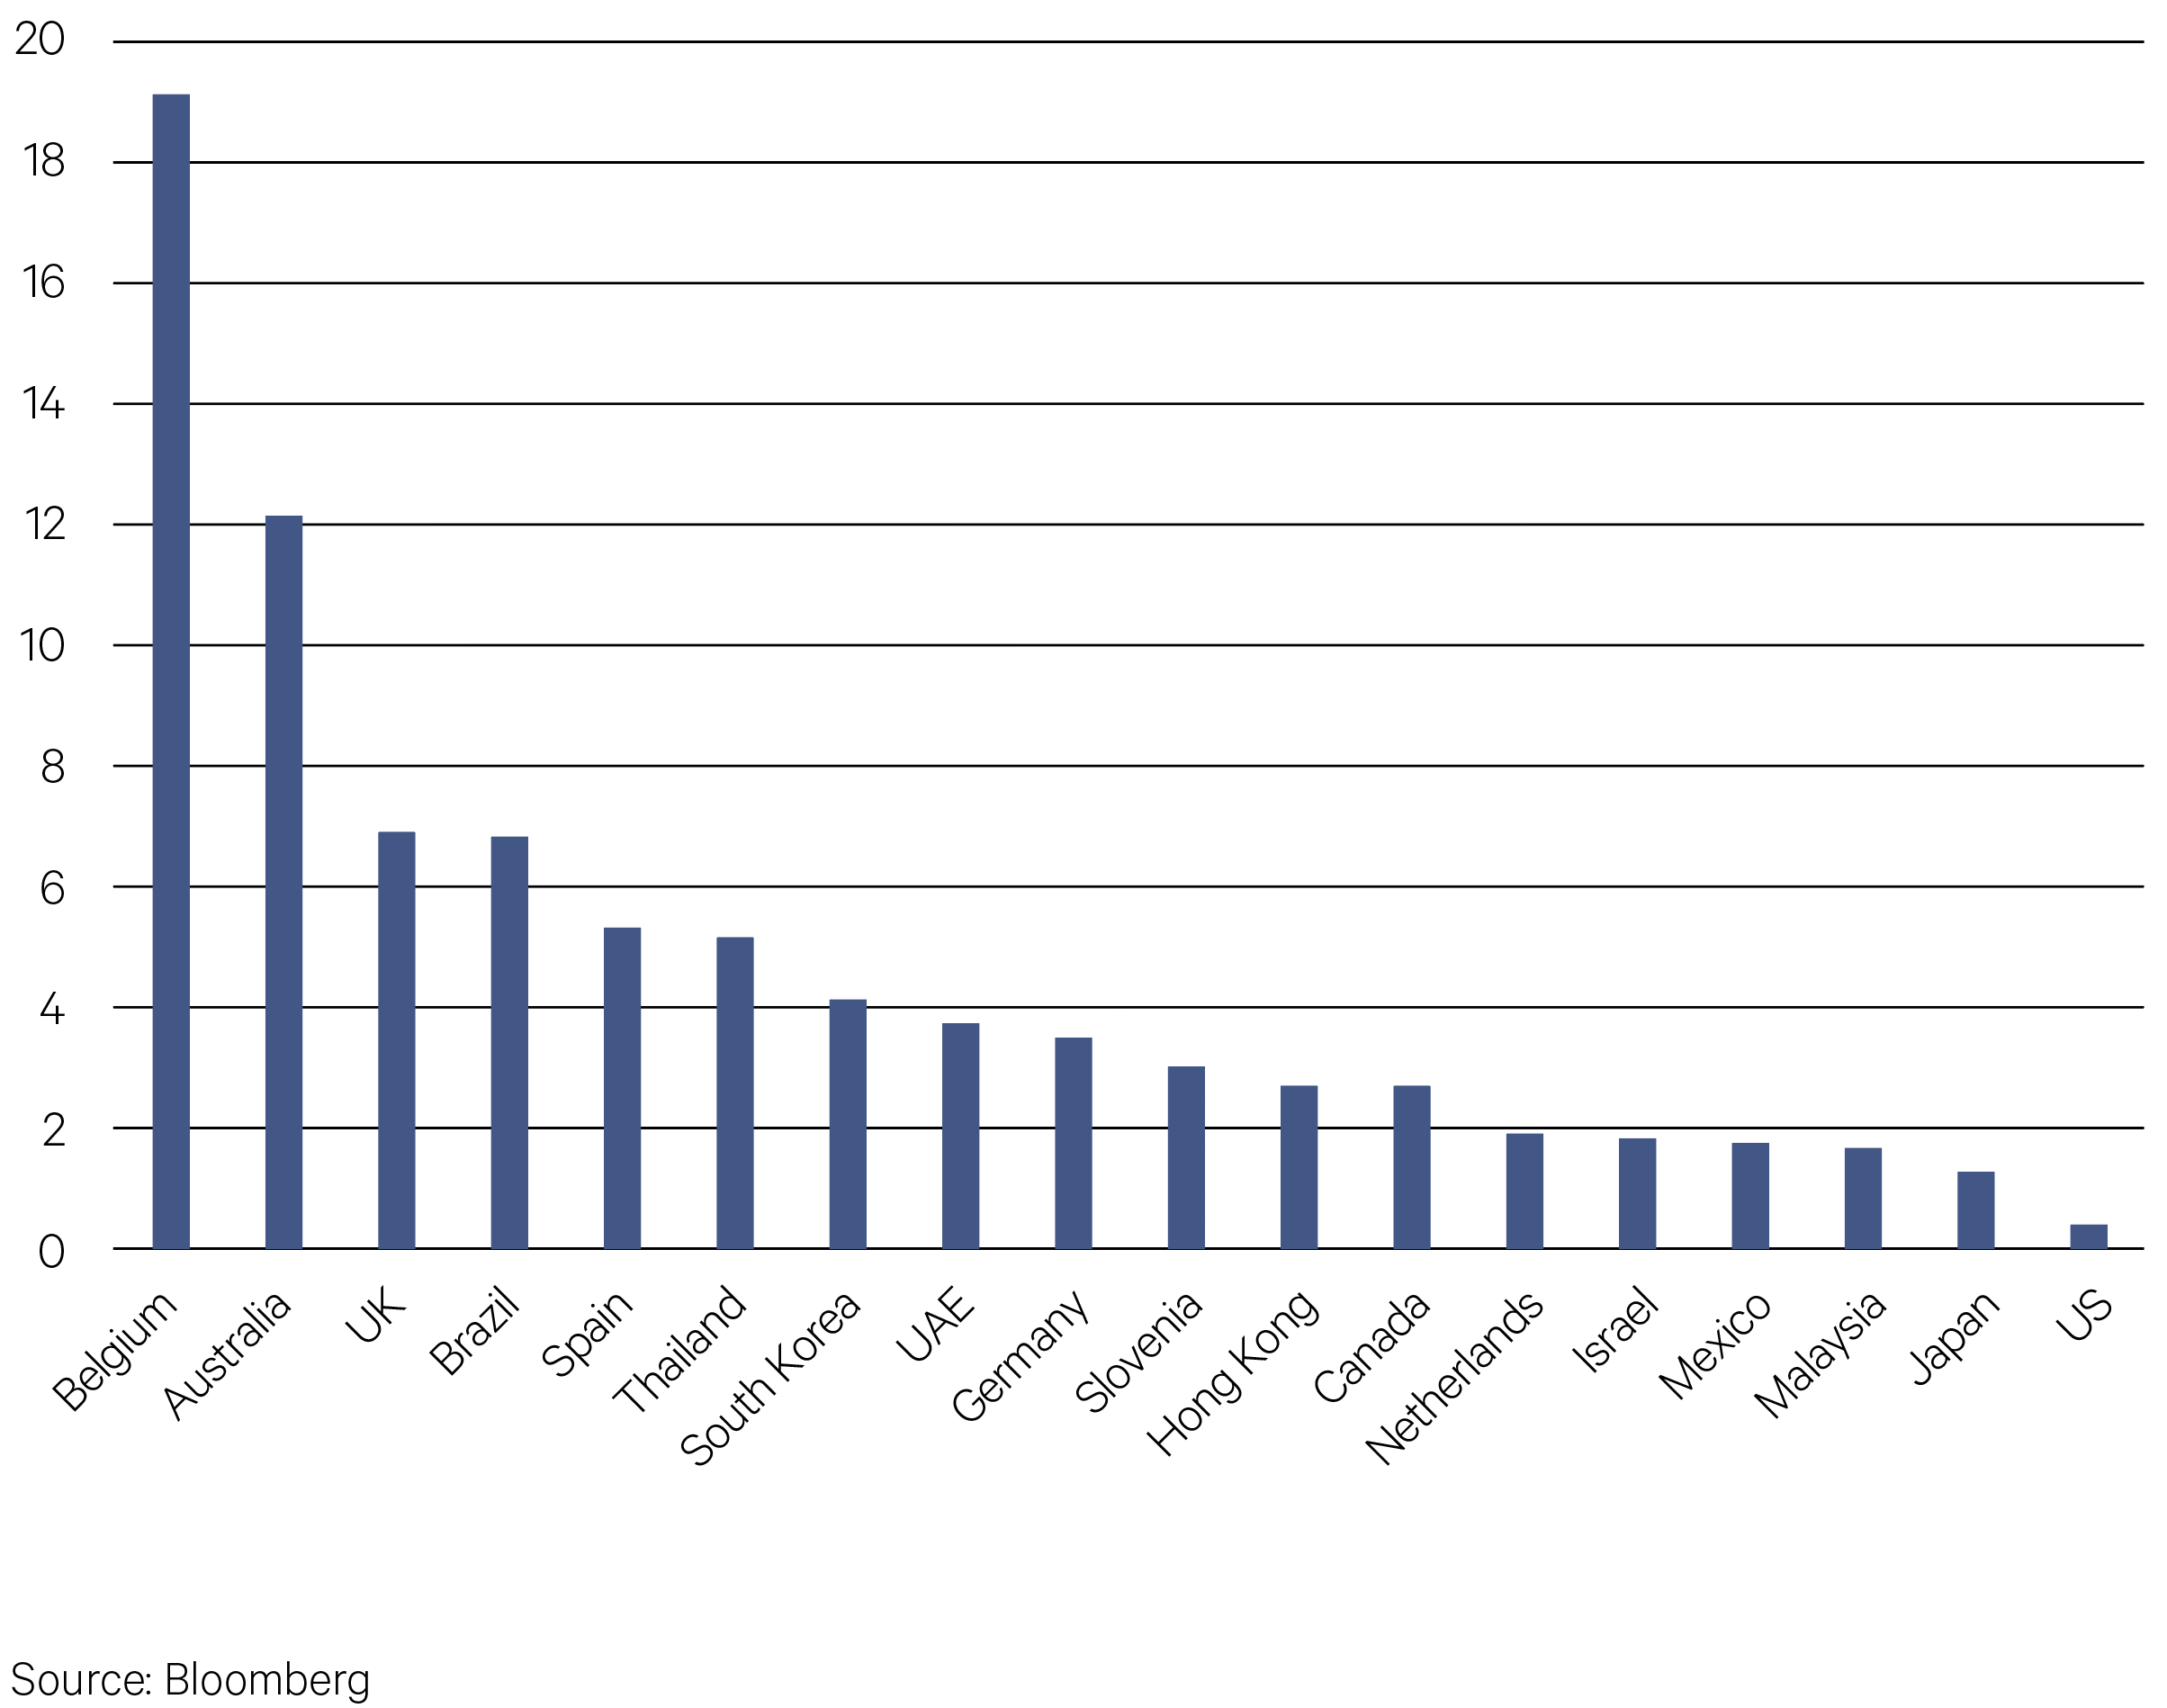
The problem with trade protectionism is it can snowball. A lift in tariffs by one country is often met with retaliation. You can be sure China will retaliate against the US for the latest round of tariffs on its electric vehicles, batteries and solar panels.
Governments are turning their back on comparative advantage, identifying national champions and spending big on friend shoring, near shoring and onshoring of manufacturing activity.
Chart 3: EU is a big destination for Chinese EVs (% total exported)

-
Australian Equities

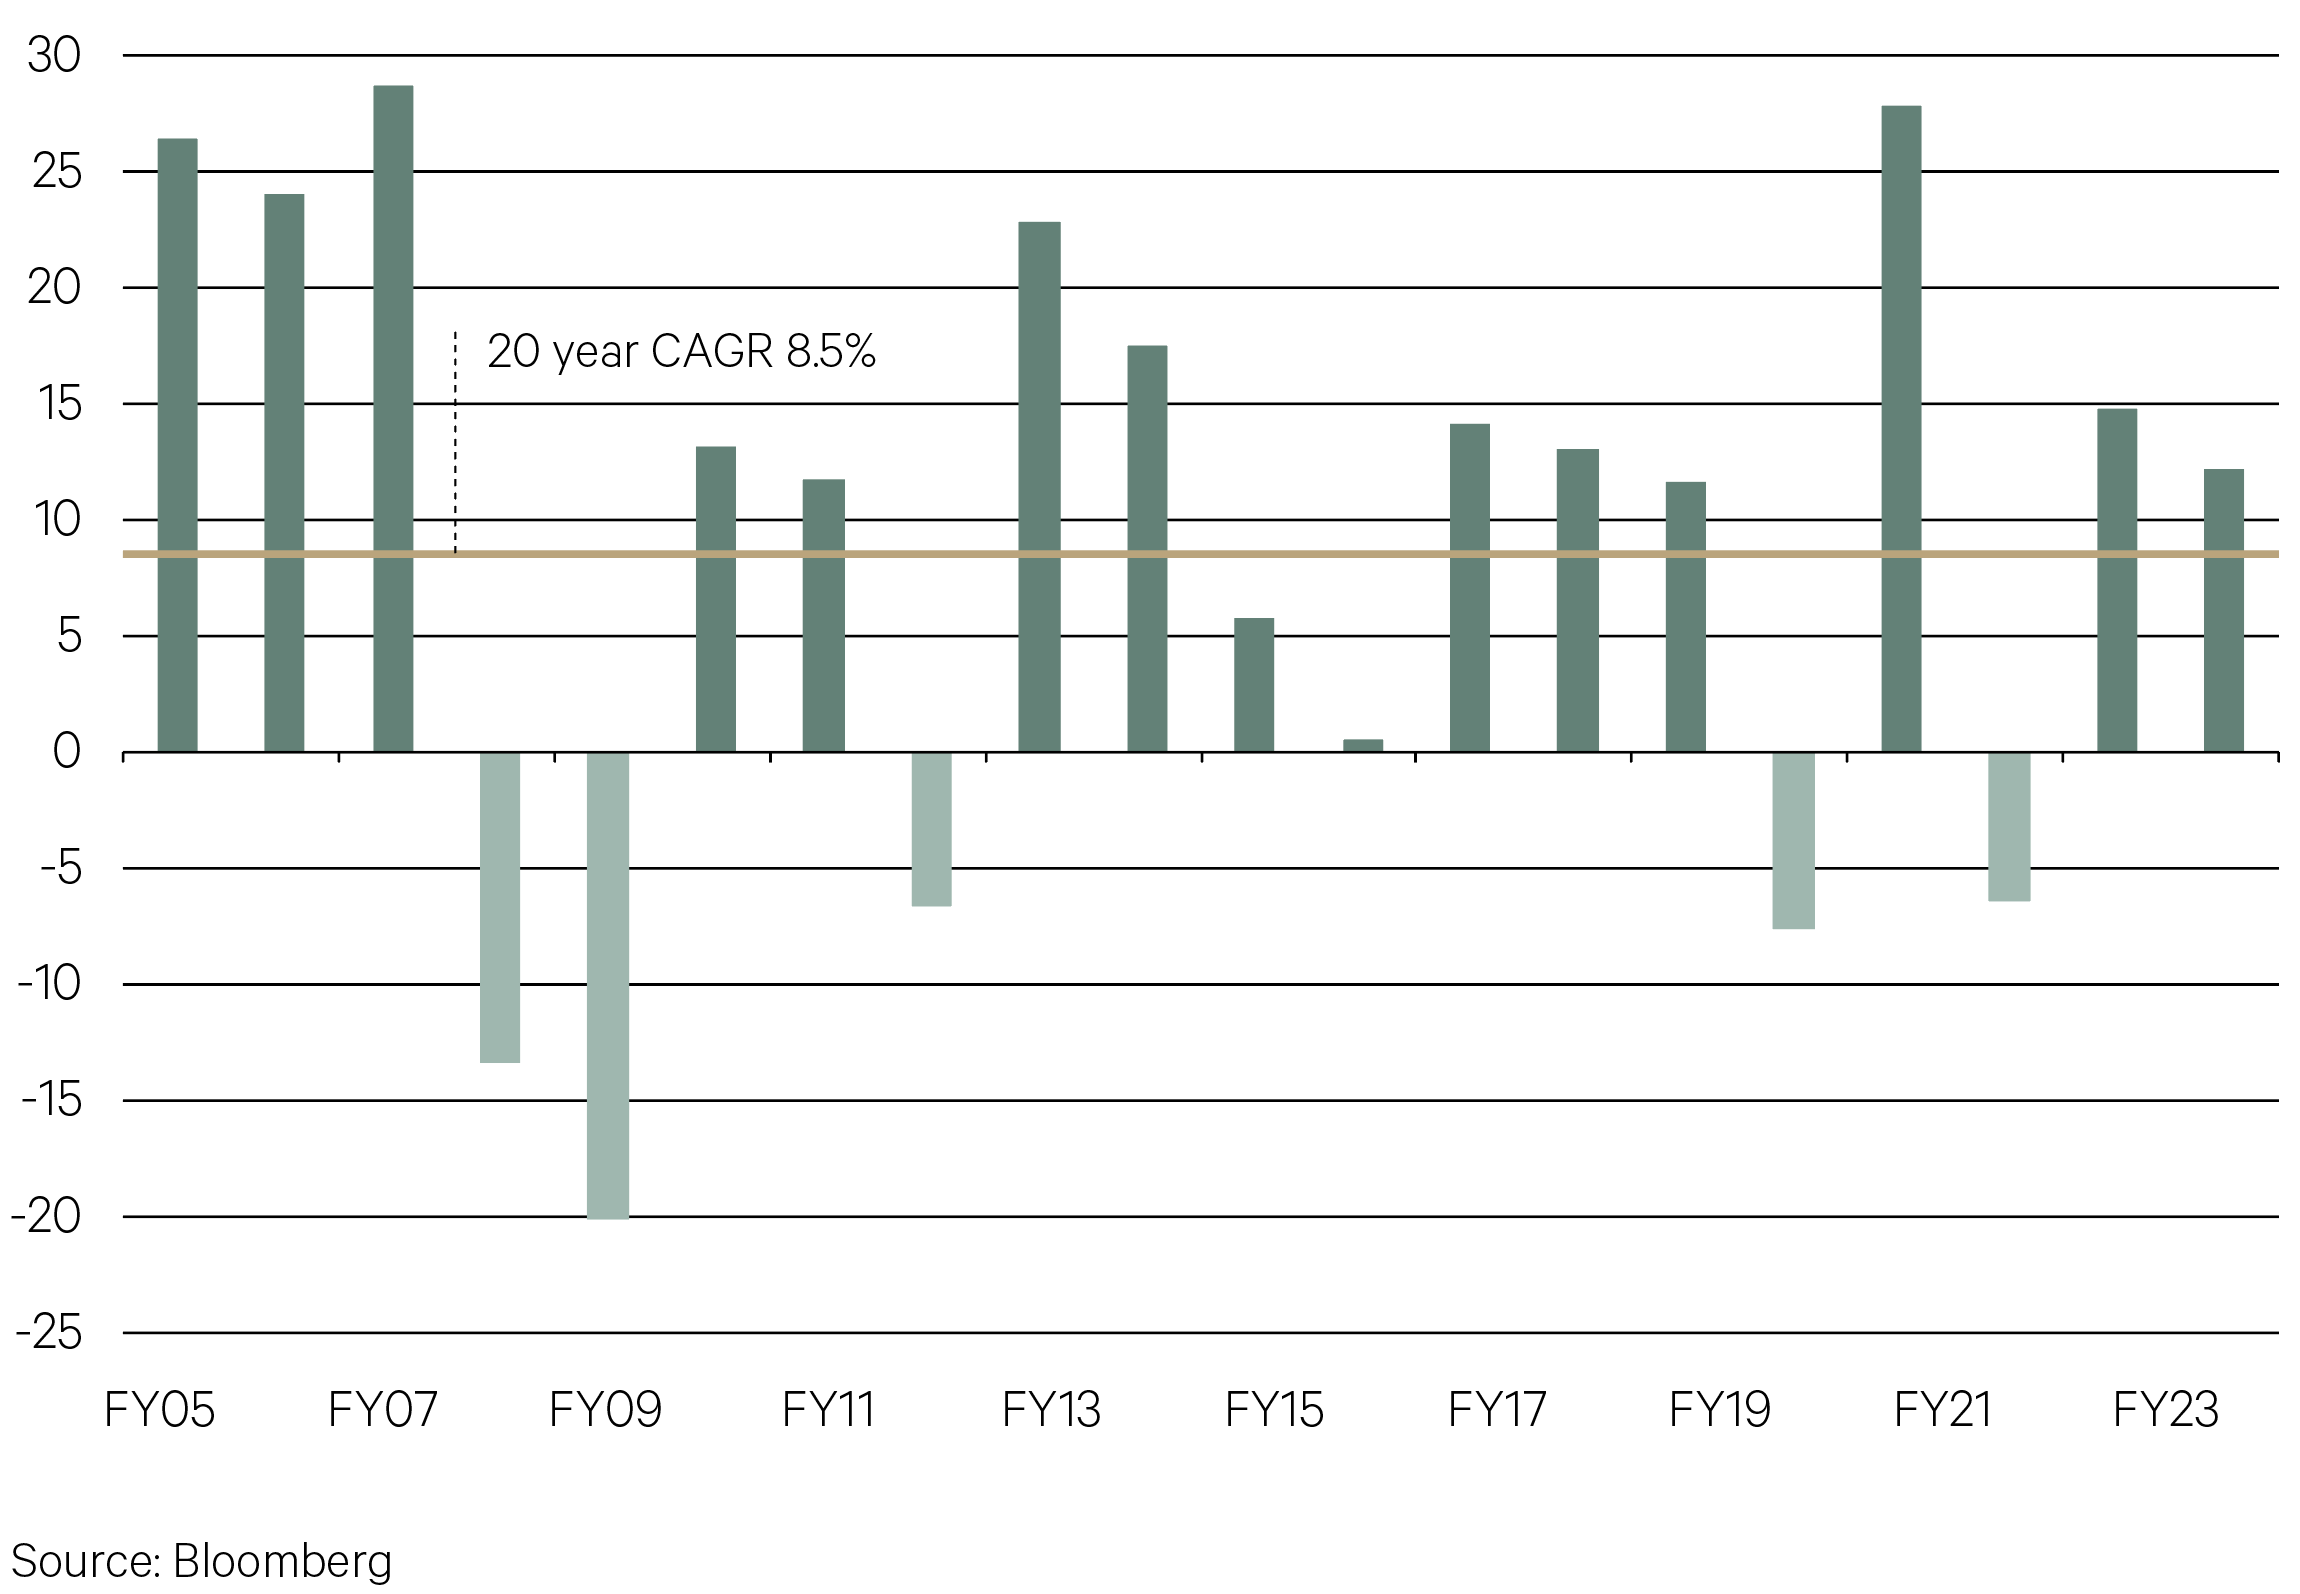
While domestic equities lagged international equities in FY24, the ASX 200 Accumulation Index still managed to post a second consecutive double-digit return for the financial year, with a total return of 12.1%. Financials, IT and real estate led the way for the 12 month period, while consumer staples and materials were the laggards. This marks the eighth year in the last decade of positive performance with a compound annual return of 8.5% over the last 20 years.
Chart 4: Double digit returns for Australian equities in FY24 (%)

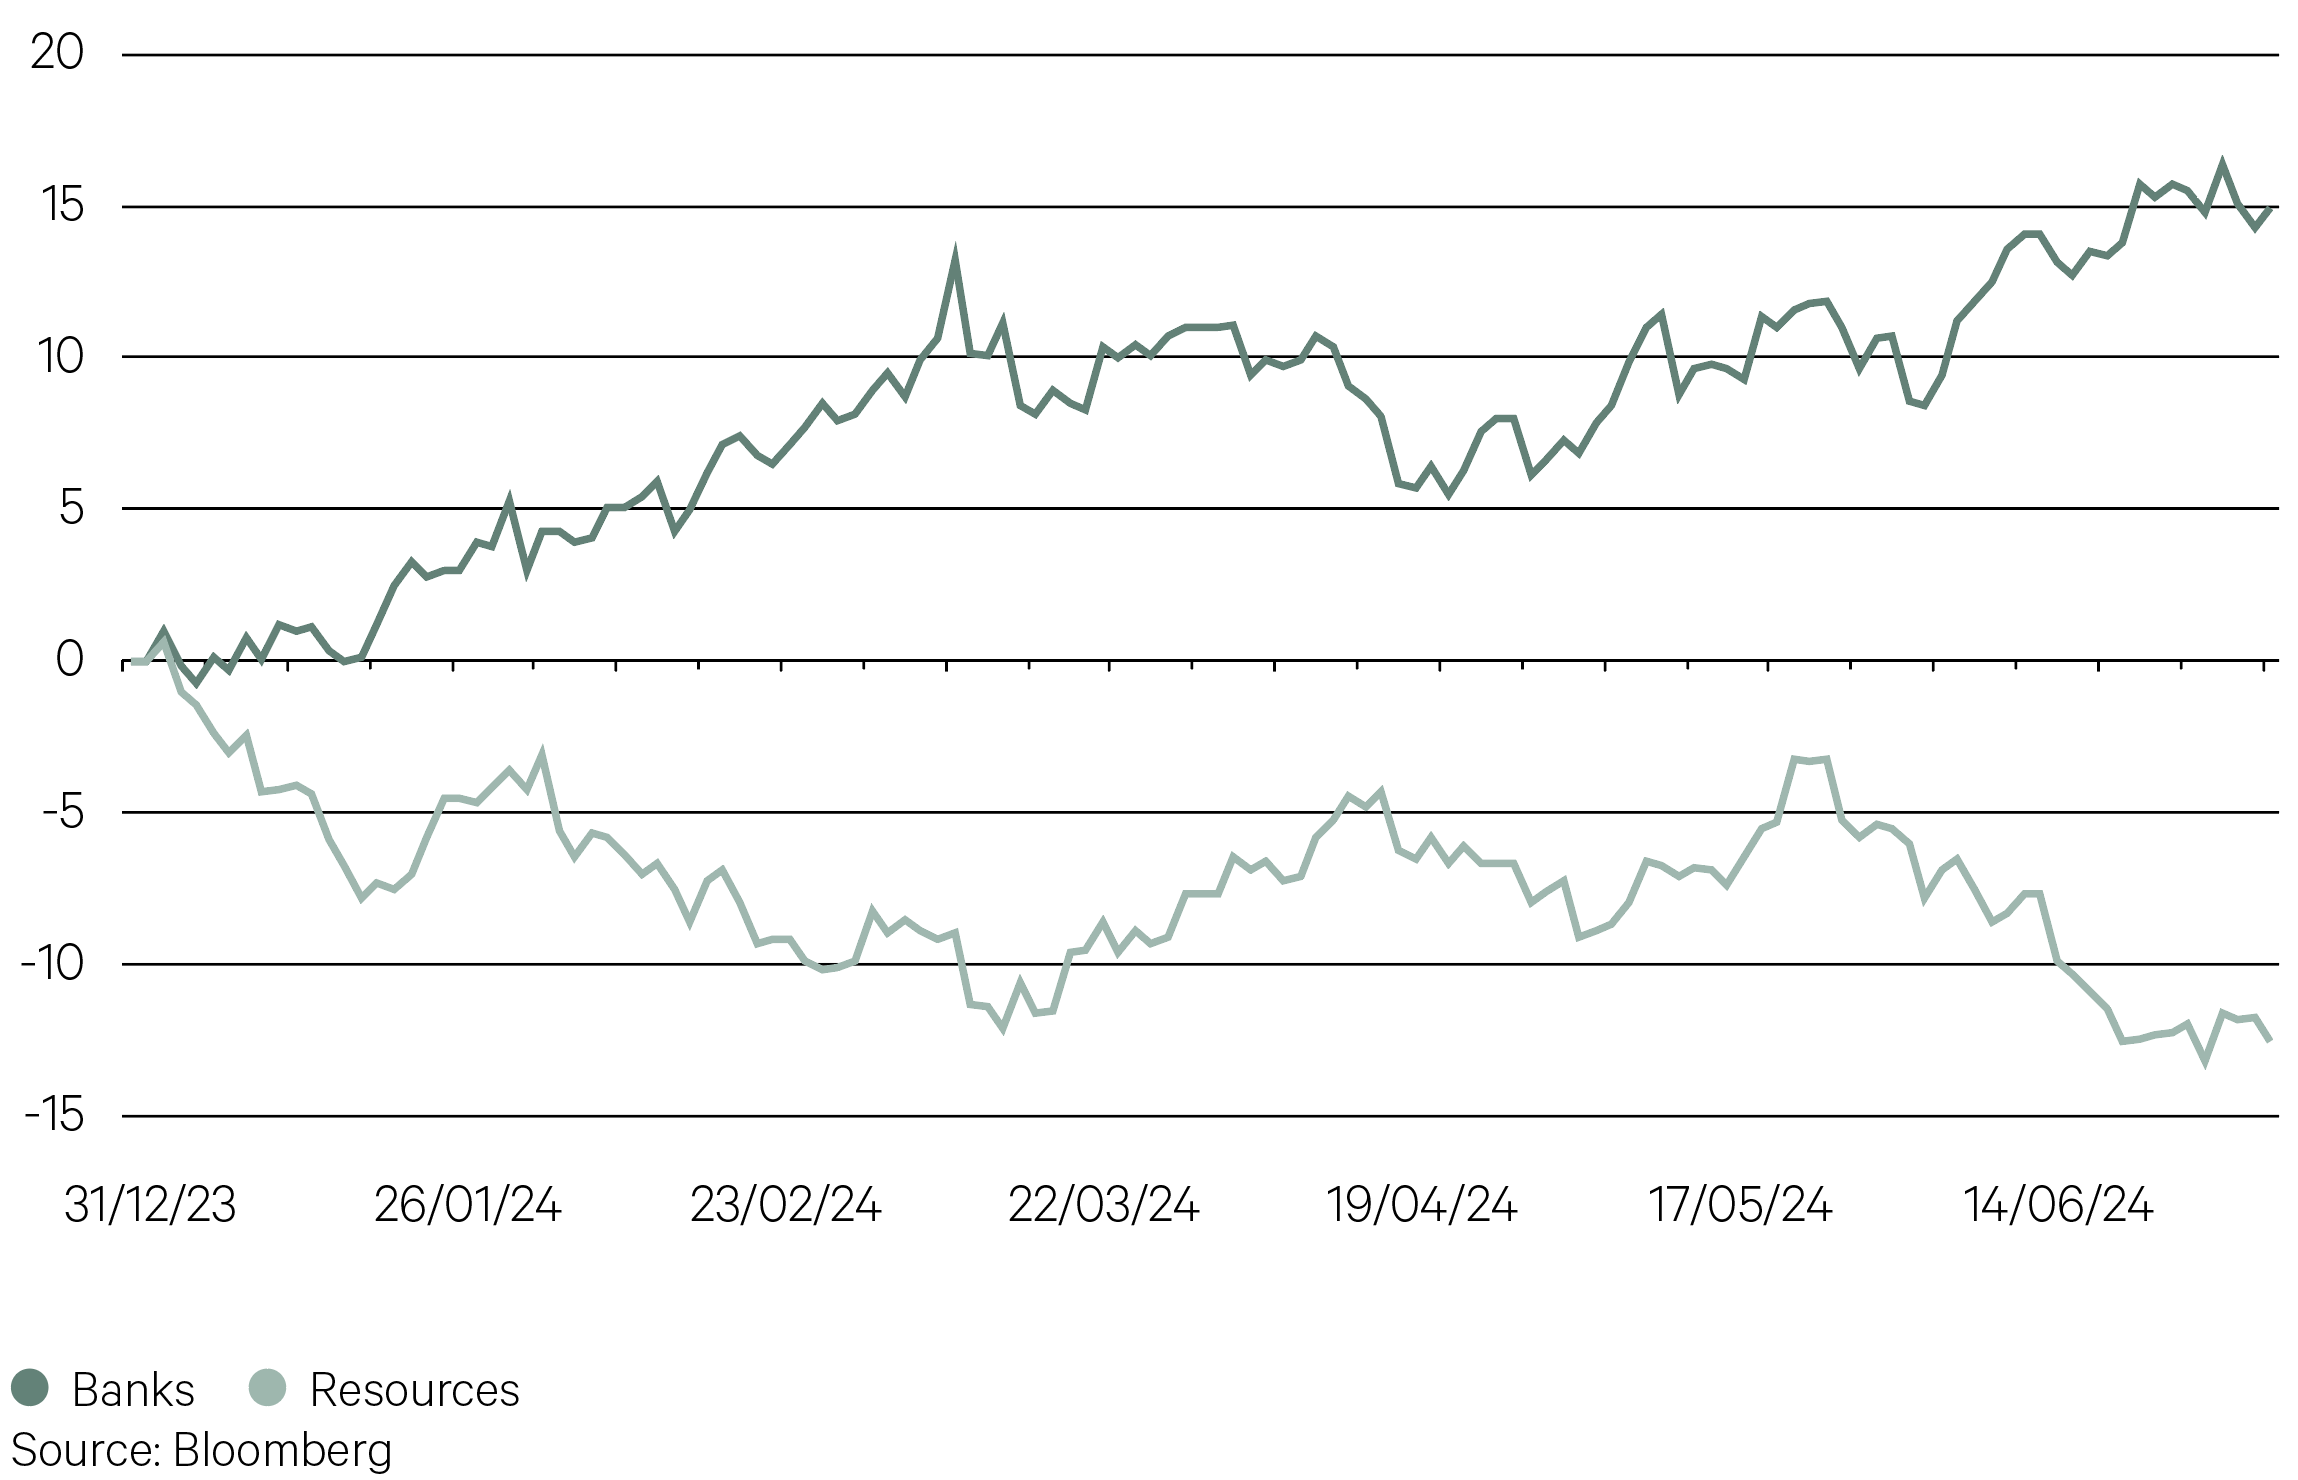
Australian equities have advanced in the first half of 2024, however, the domestic market has underperformed compared to many international equity markets. Rarely does our market outperform unless its two key cyclical sectors—banks and resources— are both doing well. The two have had contrasting fortunes so far this year, with the banks shining (despite what is seen as full valuations in the sector) and resources lagging. The soft performance of resources can be attributed to weak markets in two key commodities, iron ore and lithium.
Chart 5: Diverging cyclicals so far in 2024 for the ASX 200 (%)


Key Points
-
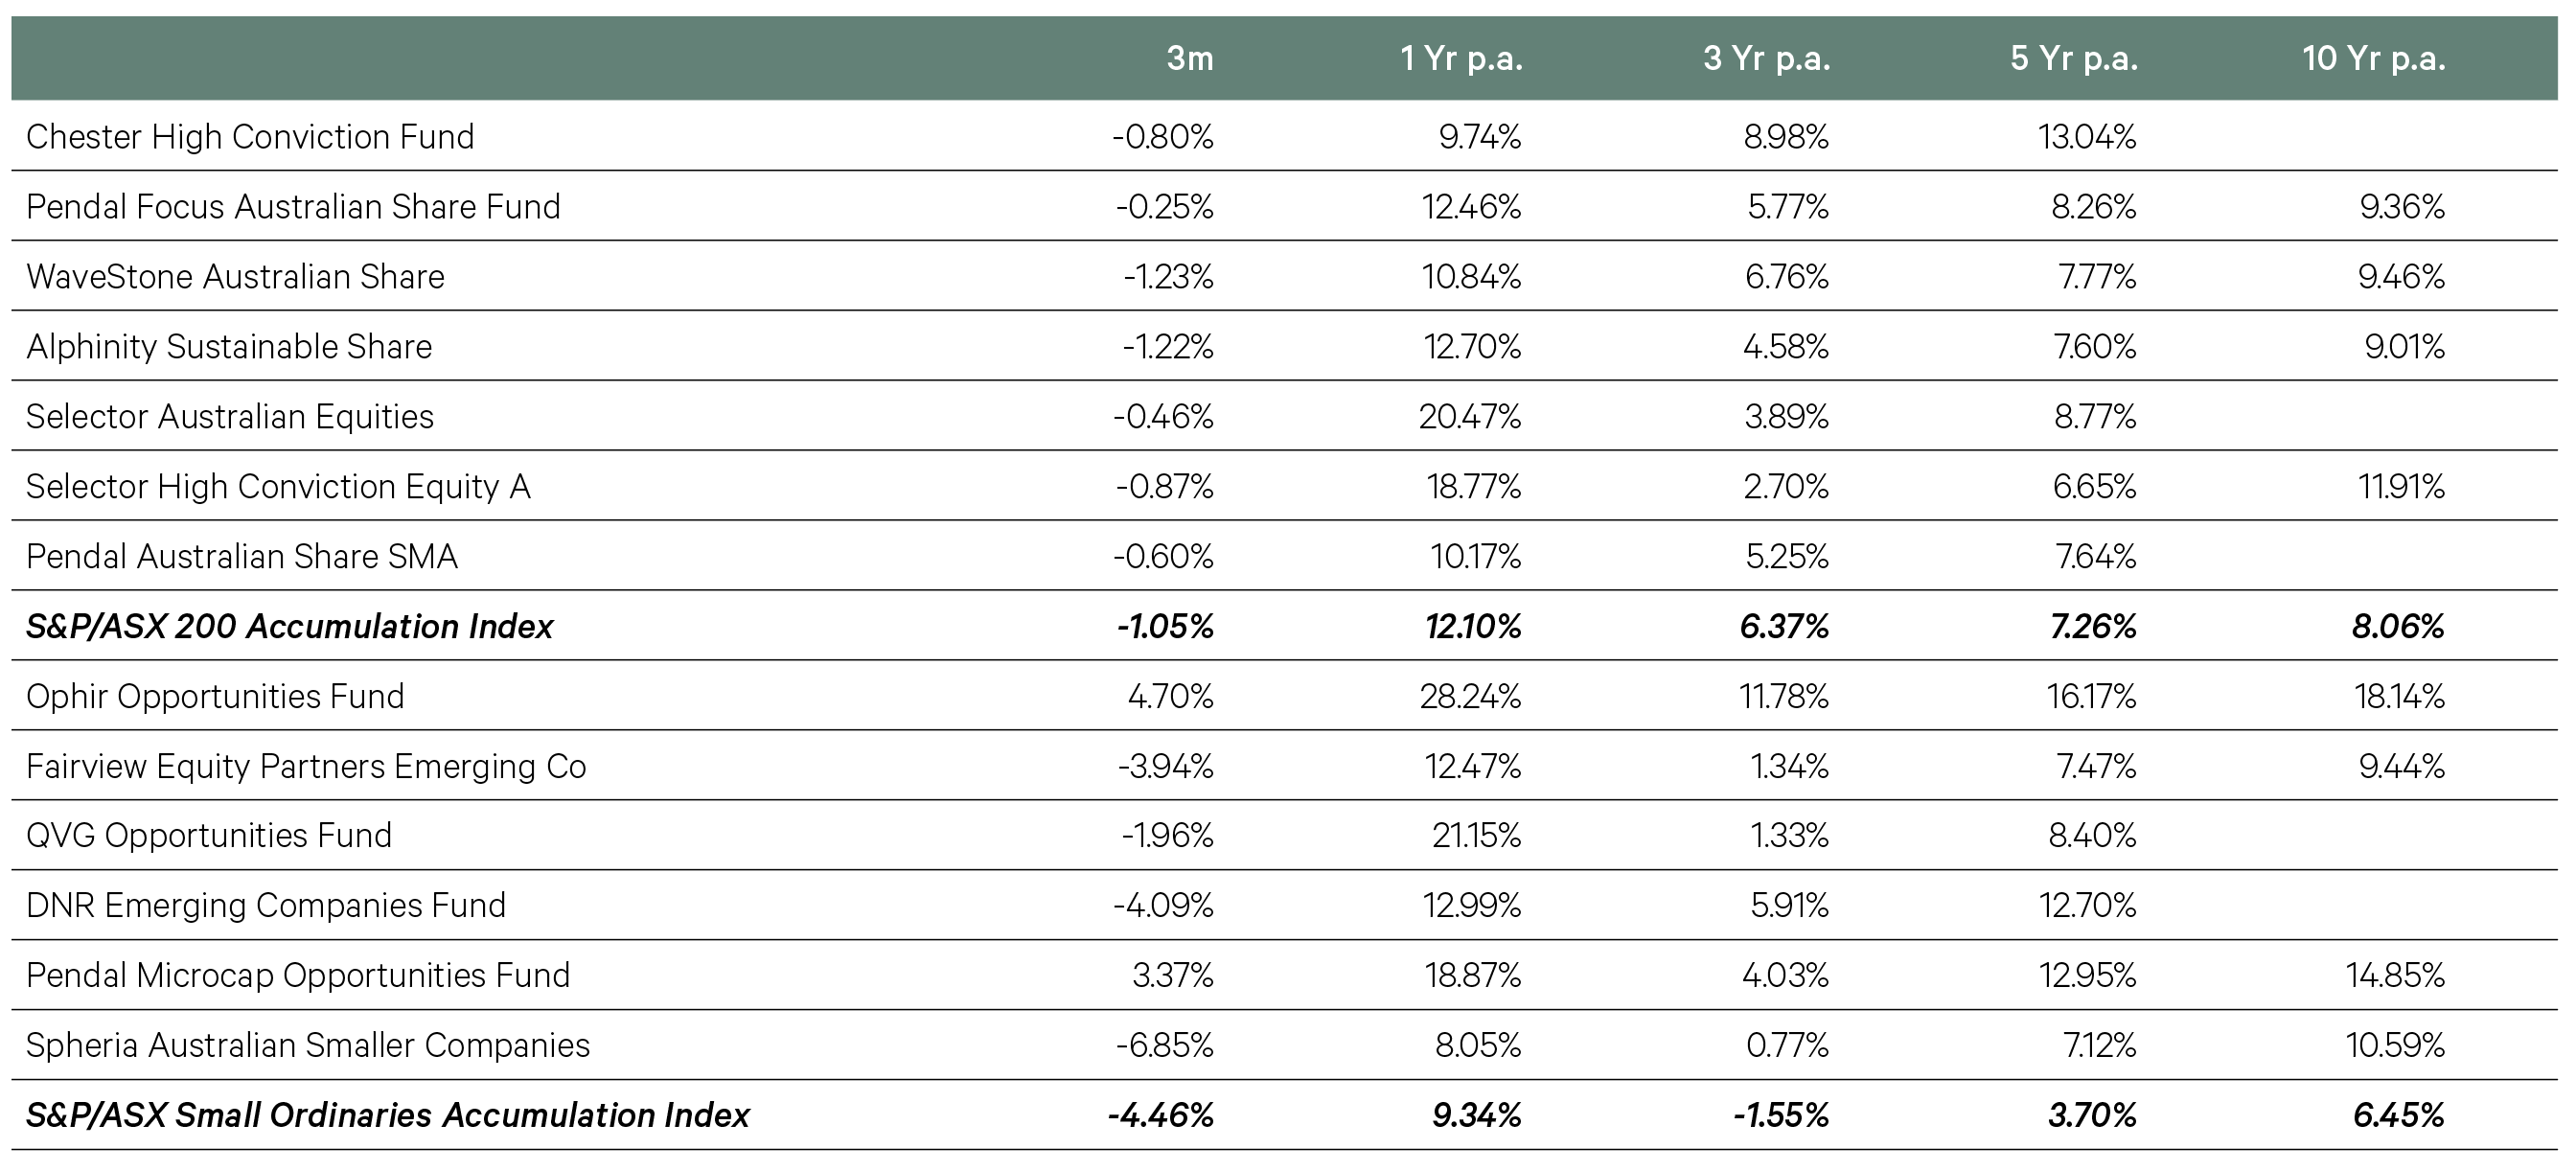
The ASX 200 was range-bound in the June quarter, losing ground in April before grinding higher across May and June. For the three months, the ASX 200 Accumulation Index delivered a total return of -1.1%.
-
Macroeconomic data continued to play a role in the near-term outlook for economic growth and corporate profitability. GDP showed that the Australian economy barely managed to grow in the March quarter, despite high population growth.
-
Additionally, recent higher than anticipated inflation prints have recast the projected trajectory of domestic monetary policy, with another cash rate hike by the RBA in the next few months now a possibility. This stands in contrast to developments in other developed economies, who have either commenced or are imminently expected to begin an easing cycle.
-
Higher domestic bond yields were the consequence of this trend and were a headwind to the Australian equity market’s performance in the quarter, particularly in April.
-
Sector performance was mixed, with the small utilities sector leading the way. Financials also performed well, with the insurers aided by higher interest rates and further buybacks were announced by the banks through May’s reporting season.
-
Energy and materials were the key laggards as commodity prices moderated, while real estate was similarly weak amid higher bond yields, giving back some of the strong gains of the March quarter.
-
Our large cap equity managers generated performance largely in line with the benchmark ASX 200 through the quarter. Selector was among the best performing, helped by gains in the IT and healthcare sectors.
-
While small caps have outpaced large caps since the most recent rally commenced in November 2023, in the June quarter they underperformed large caps by 3.4%, losing ground in each of the three months.
-
The performance of Pendal Microcap was strong given this backdrop, with robust stock picking a feature. QVG also outperformed the benchmark and returns late in the quarter were lifted by its participation in the highly publicised initial public offering (IPO) of Guzman Y Gomez. Both funds generated impressive alpha over the course of FY24.
-
Spheria’s returns fell short of the benchmark as some of the fund’s more cyclical stocks declined amid the softer economic environment.
-
-
International Equities

Equity investors have been slashing their exposure to French stocks, concerned about potential risks of tax hikes, higher borrowing costs and possibly even nationalizations. The CAC 40 hit its lowest level since late January in June.
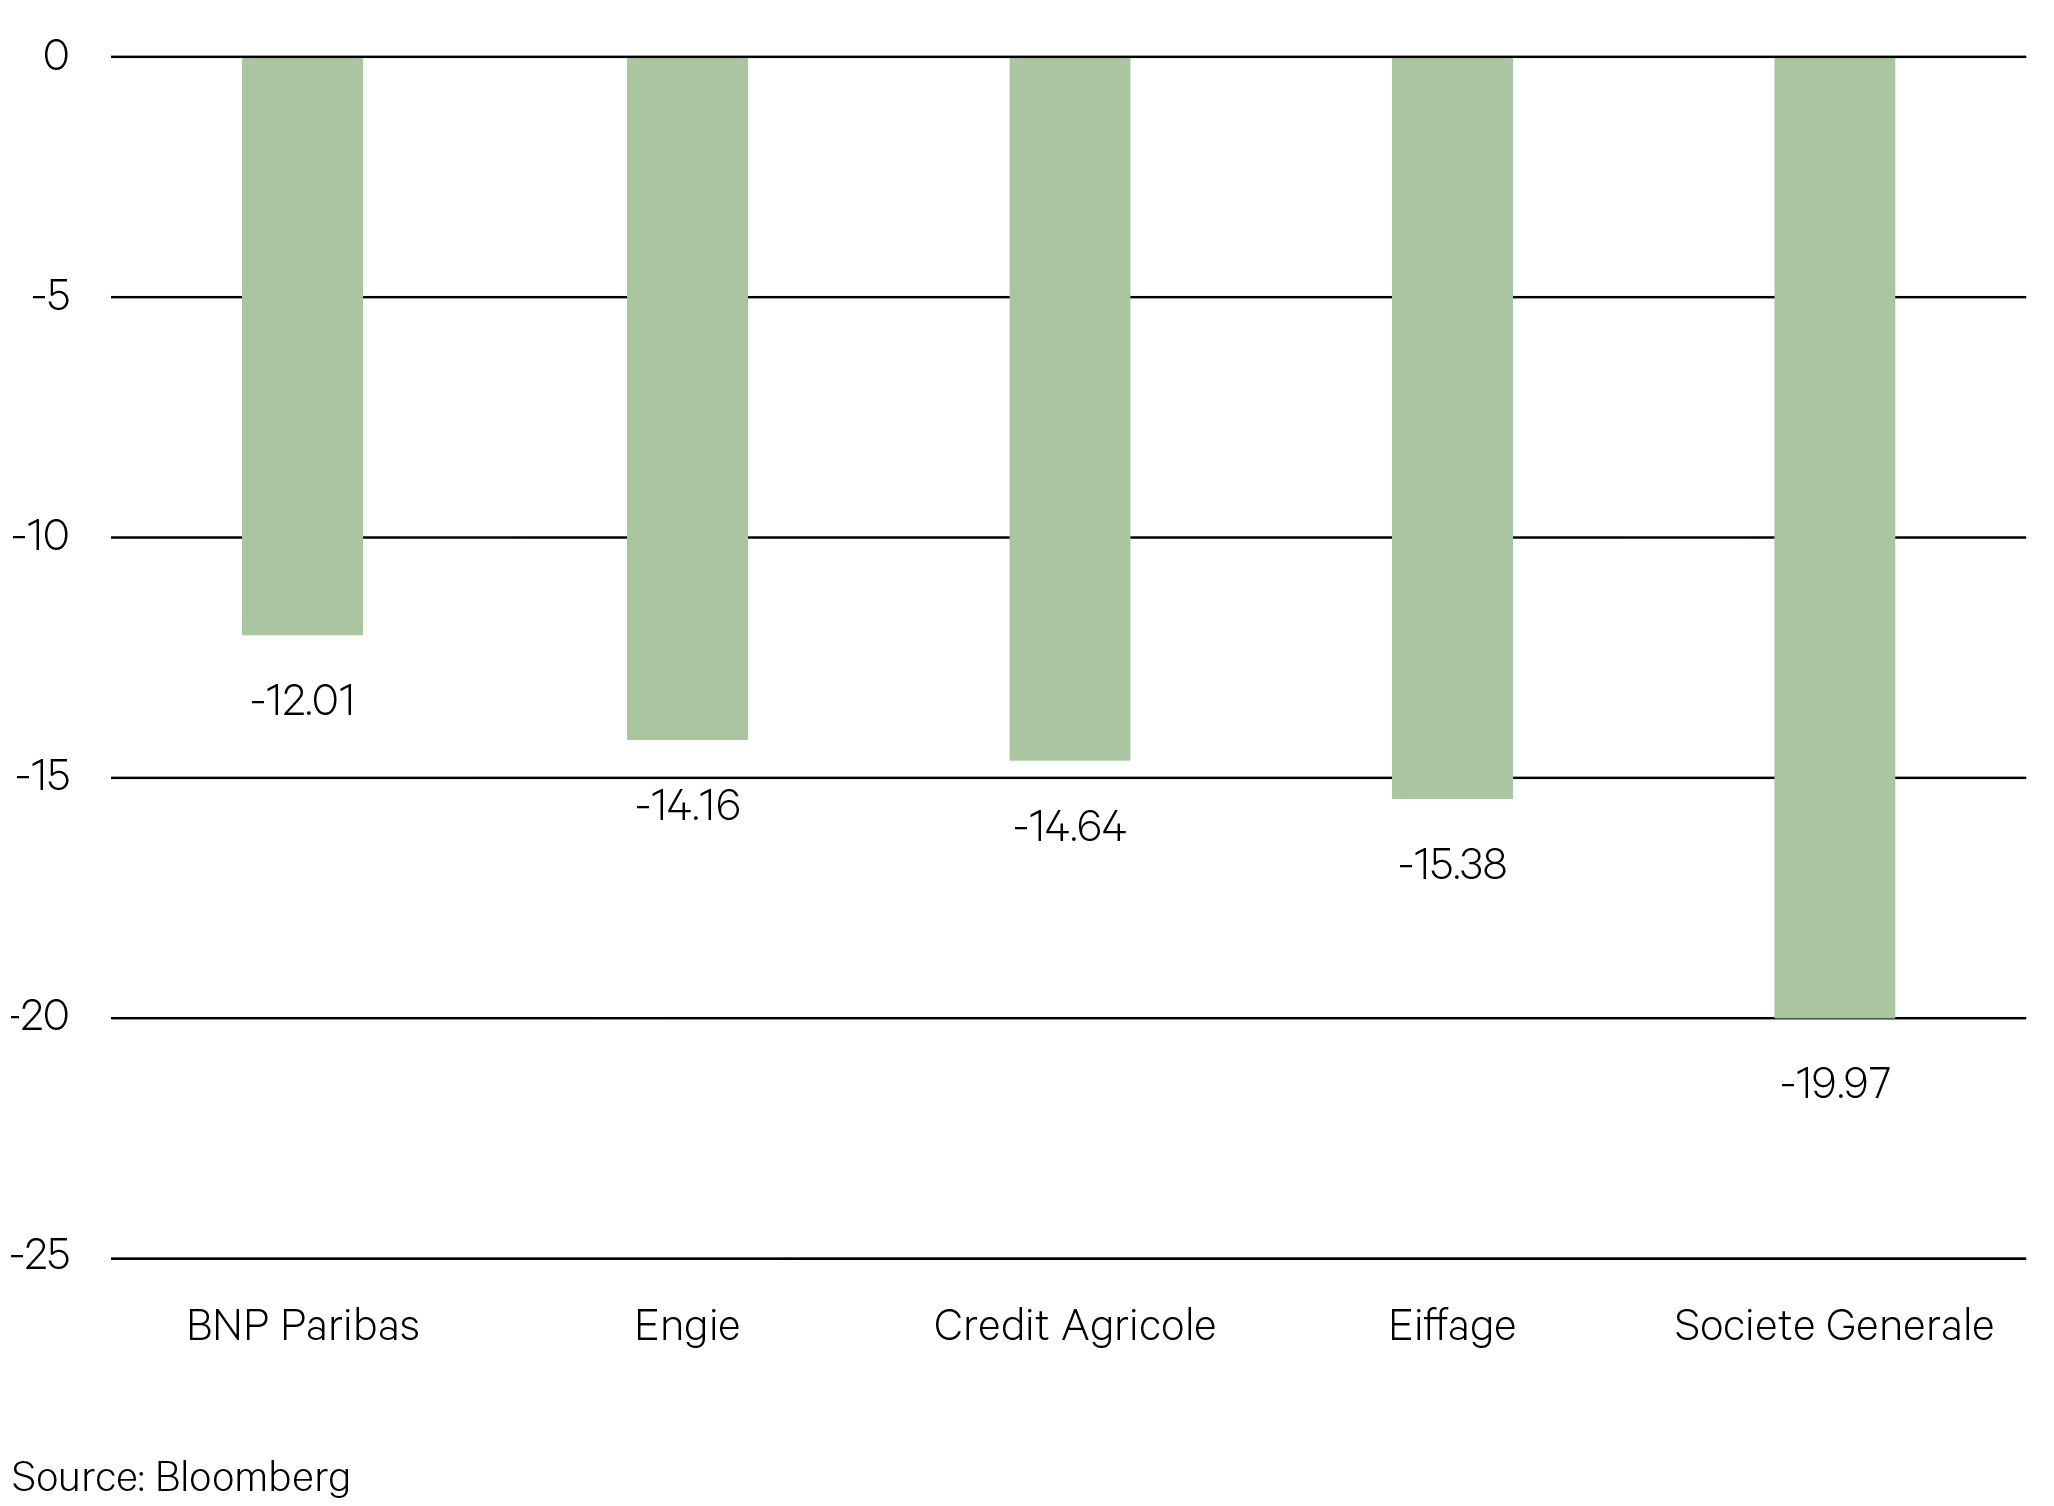
The two main opposition groups to President Emmanuel Macron’s party have big spending plans for France. Since President Emmanuel Macron’s surprise decision on June 9 to call for snap elections, SocGen has lost 16%, BNP has fallen 10%, and Credit Agricole has dropped 13%, hurt by rising political risk and the drop in French sovereign bonds. French banks are major holders of French debt. Infrastructure companies like Eiffage and Engie have been hit by concerns over increased control by the state of infrastructure concessions.
Chart 6: French bank and infrastructure stocks down in June (%)

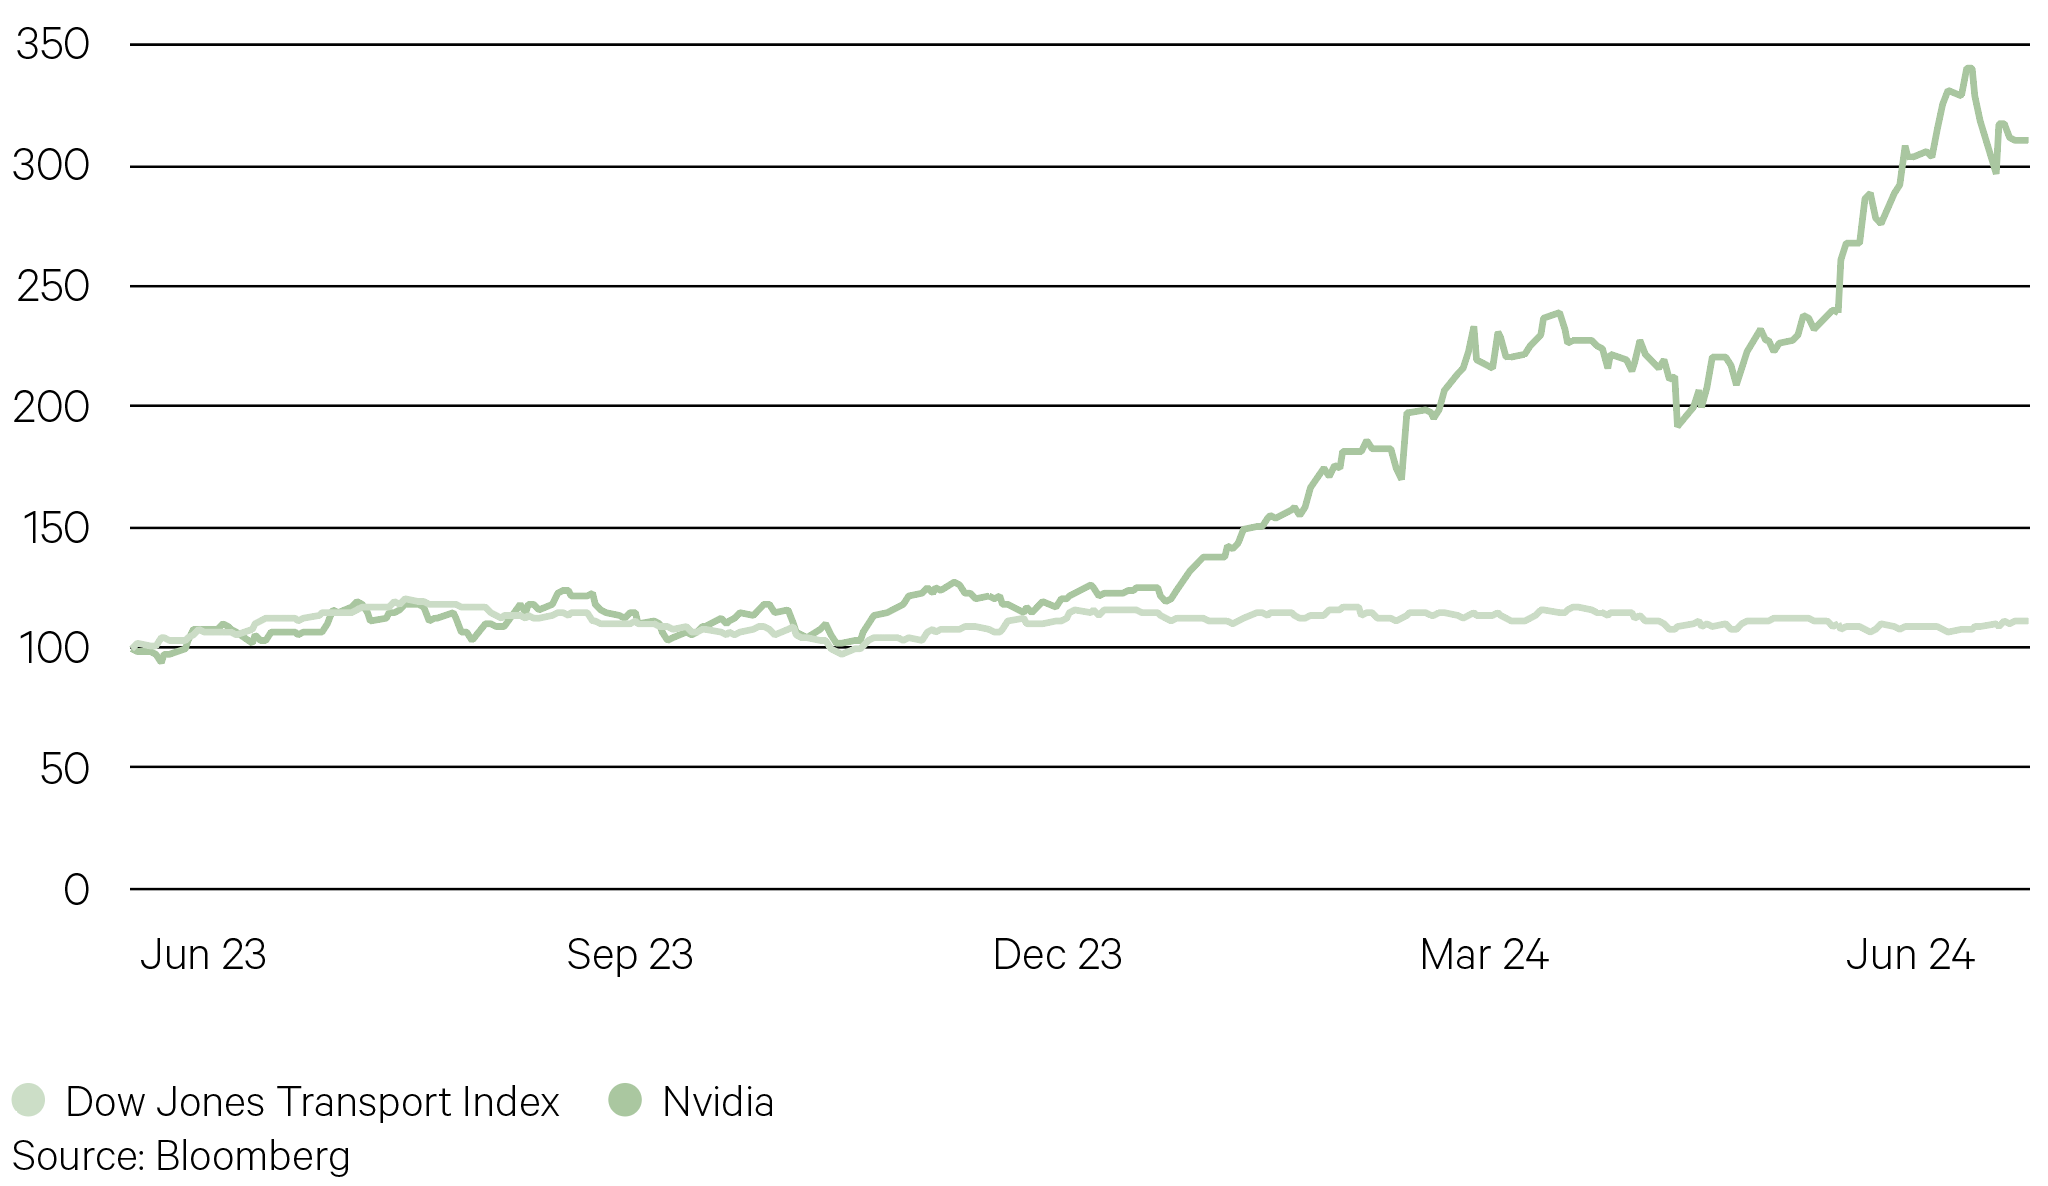
Soft economic data (including a cooling labour market, a surprise producer prices drop, and contracting factory activity) has been weighing on industrial stocks, though S&P 500 gains show that concern has been offset by confidence about a robust tech sector, generally-healthy consumers and eventually-lower rates.
Chart 7: Old vs new world stocks (Index: Jun-23=100)


Key points
-
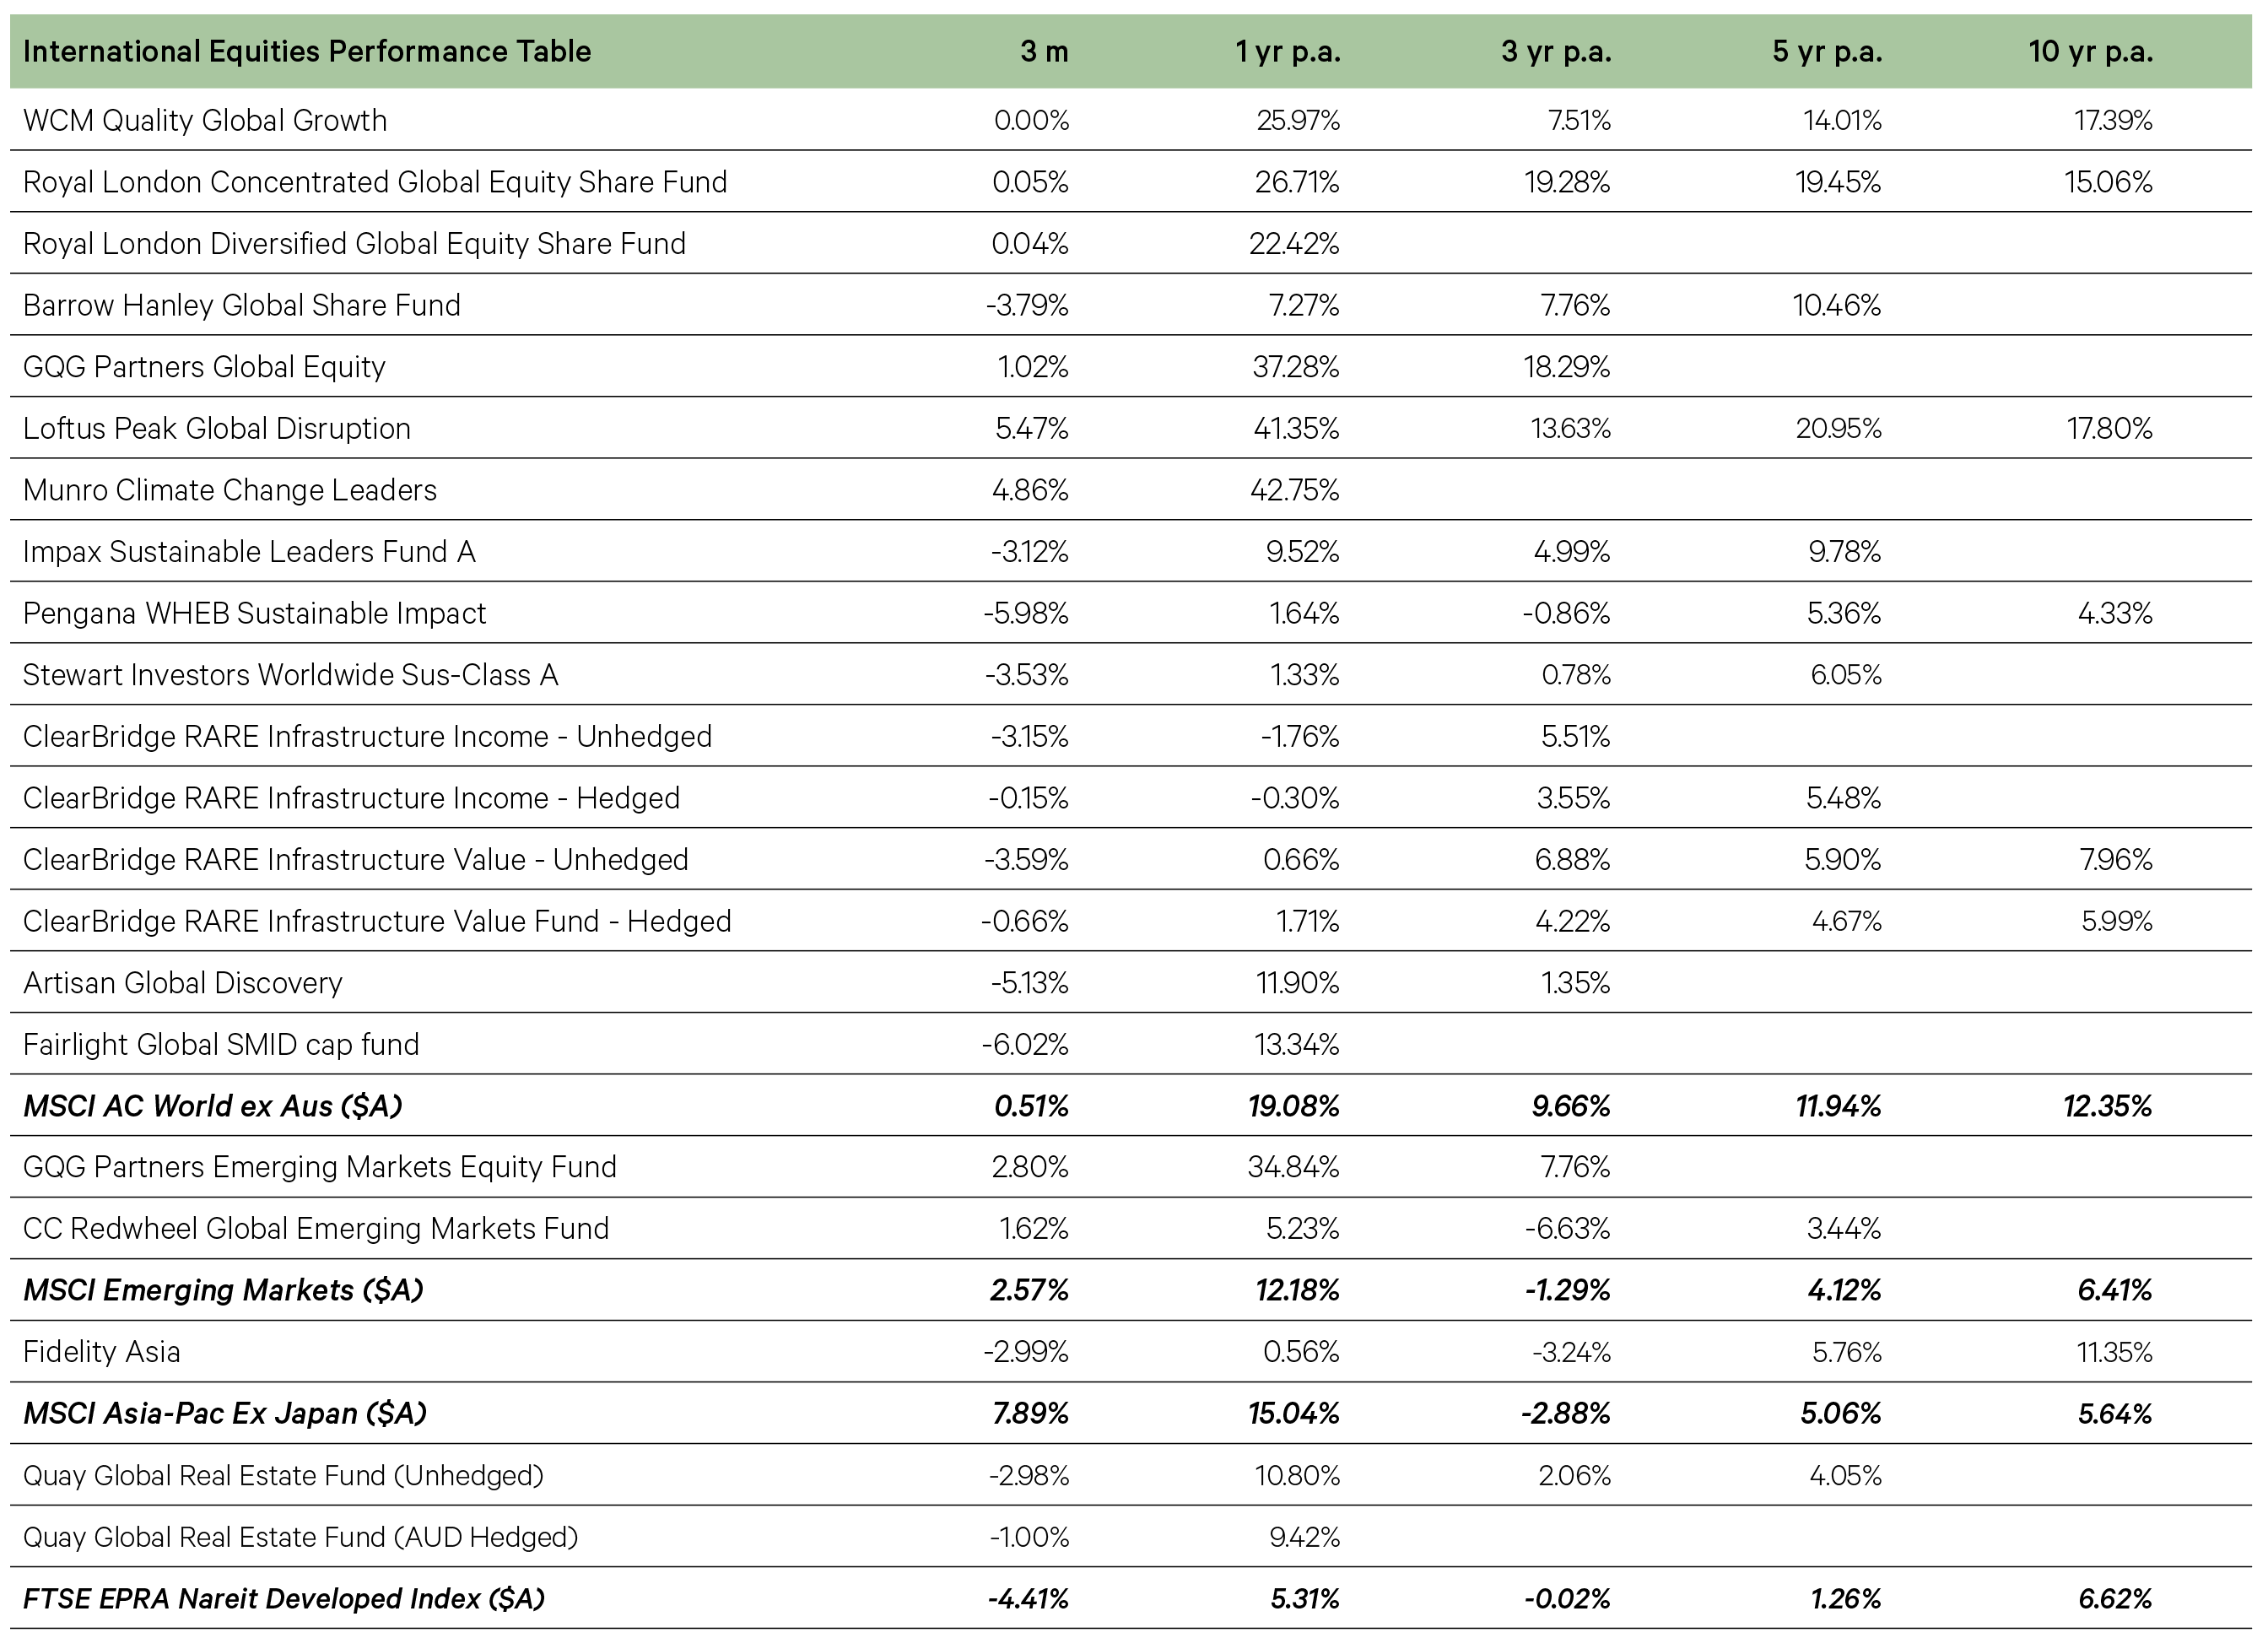
The MSCI World Index rose by 2.2% in the quarter. The rise was led by the US S&P500 which rose by 3.9%. Into quarter-end, investors lifted real estate, energy, banks and health-insurance firms as those sectors were viewed as among potential winners under a Trump presidency—the probability of which rose following the presidential debate.
-
Europe underperformed with the French CAC down 8.9% following the shock election call by President Macron. Italy fell by 4.6% after rising by 14.5% in Q1.
-
Emerging market (EM) equities outperformed developed markets, rising by 4.1%. The standout was Taiwan rising by 13.5%, helped by TSMC which was up 28.2% in the three months to June 2024.
-
Technology stocks did well as evidenced by the 8.3% rise in the NASDAQ. For the seventh consecutive quarter, Nvidia rose, finishing up 36.7% to be the best performing stock in the S&P500.
-
The Australian dollar rose particularly against the Japanese yen. This has hurt our unhedged overweight position in Japanese equities. The Aussie was also up against the USD, EUR and GBP by between 2-3% leaving hedged international equities fund outperforming unhedged.
-
Among the worst performing funds in the quarter was Barrow Hanley where performance was weighed down by its allocation to sectors such as materials, energy, healthcare and financials—all of which declined in the three months. A position in Vinci, a French operator of transport infrastructure fell into quarter-end on fears (no longer founded) the far-right National Rally would nationalize highways or further regulate the sector. Baidu also suffered. There are concerns Chinese tech firms are rationing the use of their AI services because of a lack of computing power due to the chip ban imposed by the US. This weighed on Alibaba and Baidu—both of which offer large language model applications.
-
Europe underperformed over the quarter, weighing on the funds with the largest European exposure such as Stewart and RARE Infrastructure.
-
The best performing fund was Loftus Peak where its holdings in semiconductor companies like Nvidia and Broadcom did well as did the foundries TSMC and South Koreas’ SK Hynix.
-
-
Fixed Income

Why is everyone holidaying in Japan? Because you have to go back to 1990 to see the yen this weak against the Aussie. Why so weak?
The biggest driver of the yen’s depreciation in 2024 is the yawning gap in interest rates between Japan and Australia (and the US). Watching when the Japanese government will next intervene to cushion the slide has become secondary to guessing how the yen will react to key Australian and US data. Both the US and Australian central banks will likely be among the last to cut interest rates. That is keeping upward pressure on their currencies against the yen. Whatever happens in Tokyo is of little importance. Even the BOJ ending its negative rate policy had little impact nor did Bank of Japan intervention to try and support the yen.
Chart 8: Australian dollar, Japanese yen exchange rate

US bond yields are rising again amid fears that bond vigilantes are returning to the long end of the bond market. Investors are betting that former President Donald Trump emerged victorious in the recent debate. Investors believe that augurs well for more tariffs and continued increased Treasury bond issuance—forcing bond investors to demand more premium. Plus, a banner first half of the year for US stocks with the S&P 500 up over 14% year-to-date boding well for future returns in the second half also has bond investors demanding more return.
Chart 9: US bond yields rising (%)


Key points
-
Bond yields were higher over the quarter driven in particular by sharp rises in April when Australian and US 10-year bond yields rose by 46 and 48 basis points respectively on the back of higher inflation readings. Moreover, geopolitical tensions were also heightened in the Middle East, and Iran launched a drone and missile attack on Israel on April 13, marking the first time there’d been a direct attack on Israel from Iran.
-
Through May and June yields partially reversed as the US equity market hit a new all-time high. That was supported by comments from Fed Chair Powell, who said that “I think it’s unlikely that the next policy rate move will be a hike”. US inflation also showed signs of easing.
-
ECB delivered its first rate cut since the pandemic, lowering the deposit rate by 25bps to 3.75%. The Bank of Canada also delivered its first rate cut of this cycle, meaning that four of the G10 central banks have now cut rates this year (Sweden and Switzerland being the other two).
-
Even though the ECB cut rates in June, investors moved to price in a more gradual pace of rate cuts over the months ahead and markets reacted to the political swing to the right in some of the fiscally less frugal countries such as France and Italy. German 10-year yields rose by 20bpts while French and Italian yields rose 49 and 39 bpts respectively.
-
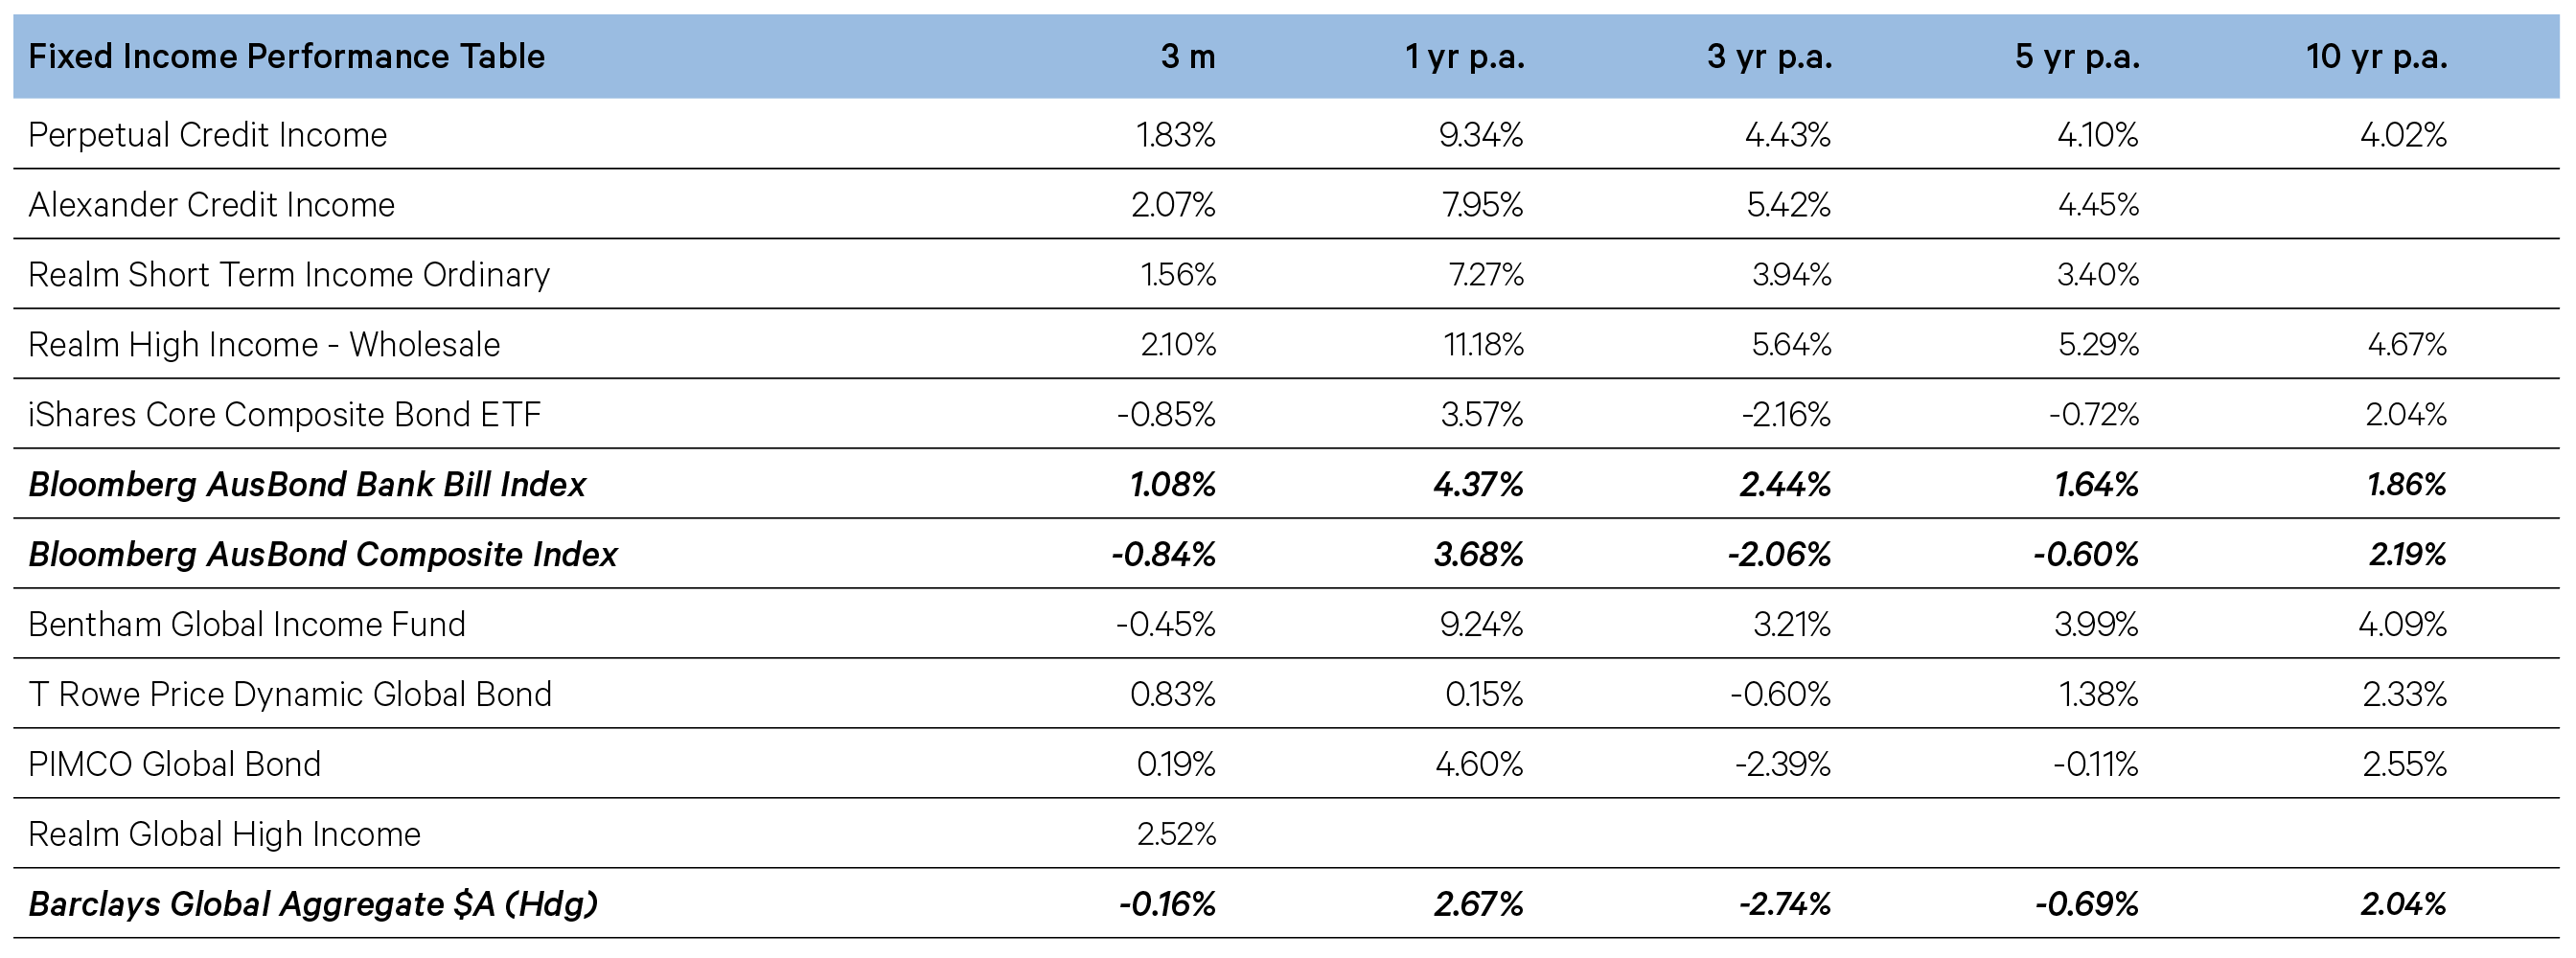
Given the rise in government bond yields over the quarter, any fund that had duration as its core underperformed. This was the case for Bentham, PIMCO and T. Rowe Price.
-
Our floating rate credit funds in contrast outperformed, particularly those that had access to the broader global universe rather than being limited to Australia
-
-
Alternatives

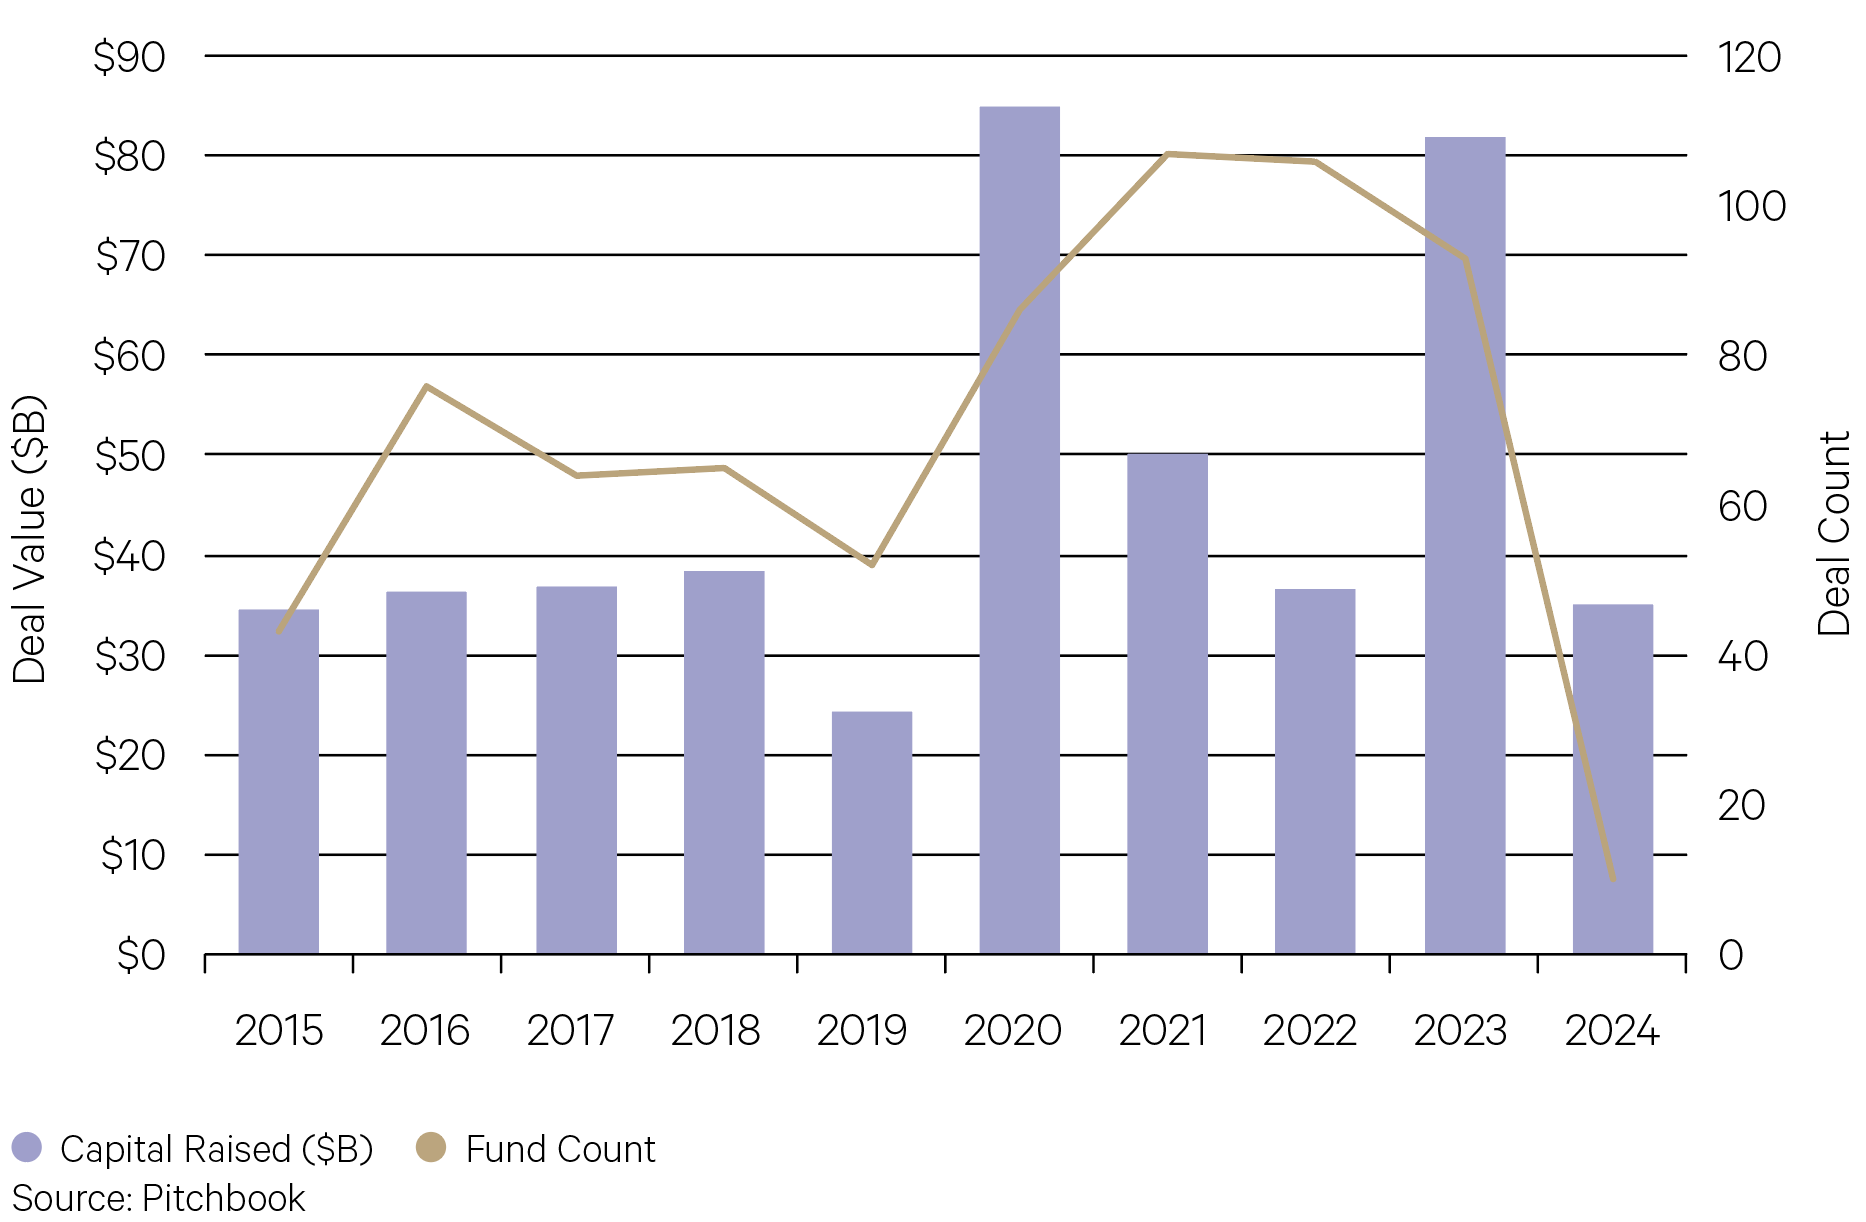
Secondaries fundraising is off to a strong start through Q1 2024 with $35.0 billion raised. This marks the highest fundraising amount for the strategy in any first quarter going back to 2008 and represents a 6.0% YoY increase from the $33.0 billion raised in Q1 2023. Given that traditional exit routes are limited, secondaries are growing as a share of private capital raised. A lot of money is concentrated in mega funds that opportunistically transact on large-scale deals across asset classes. However, plenty of deals are also happening on the smaller end of the market.
Chart 10: Secondaries fundraising is rising

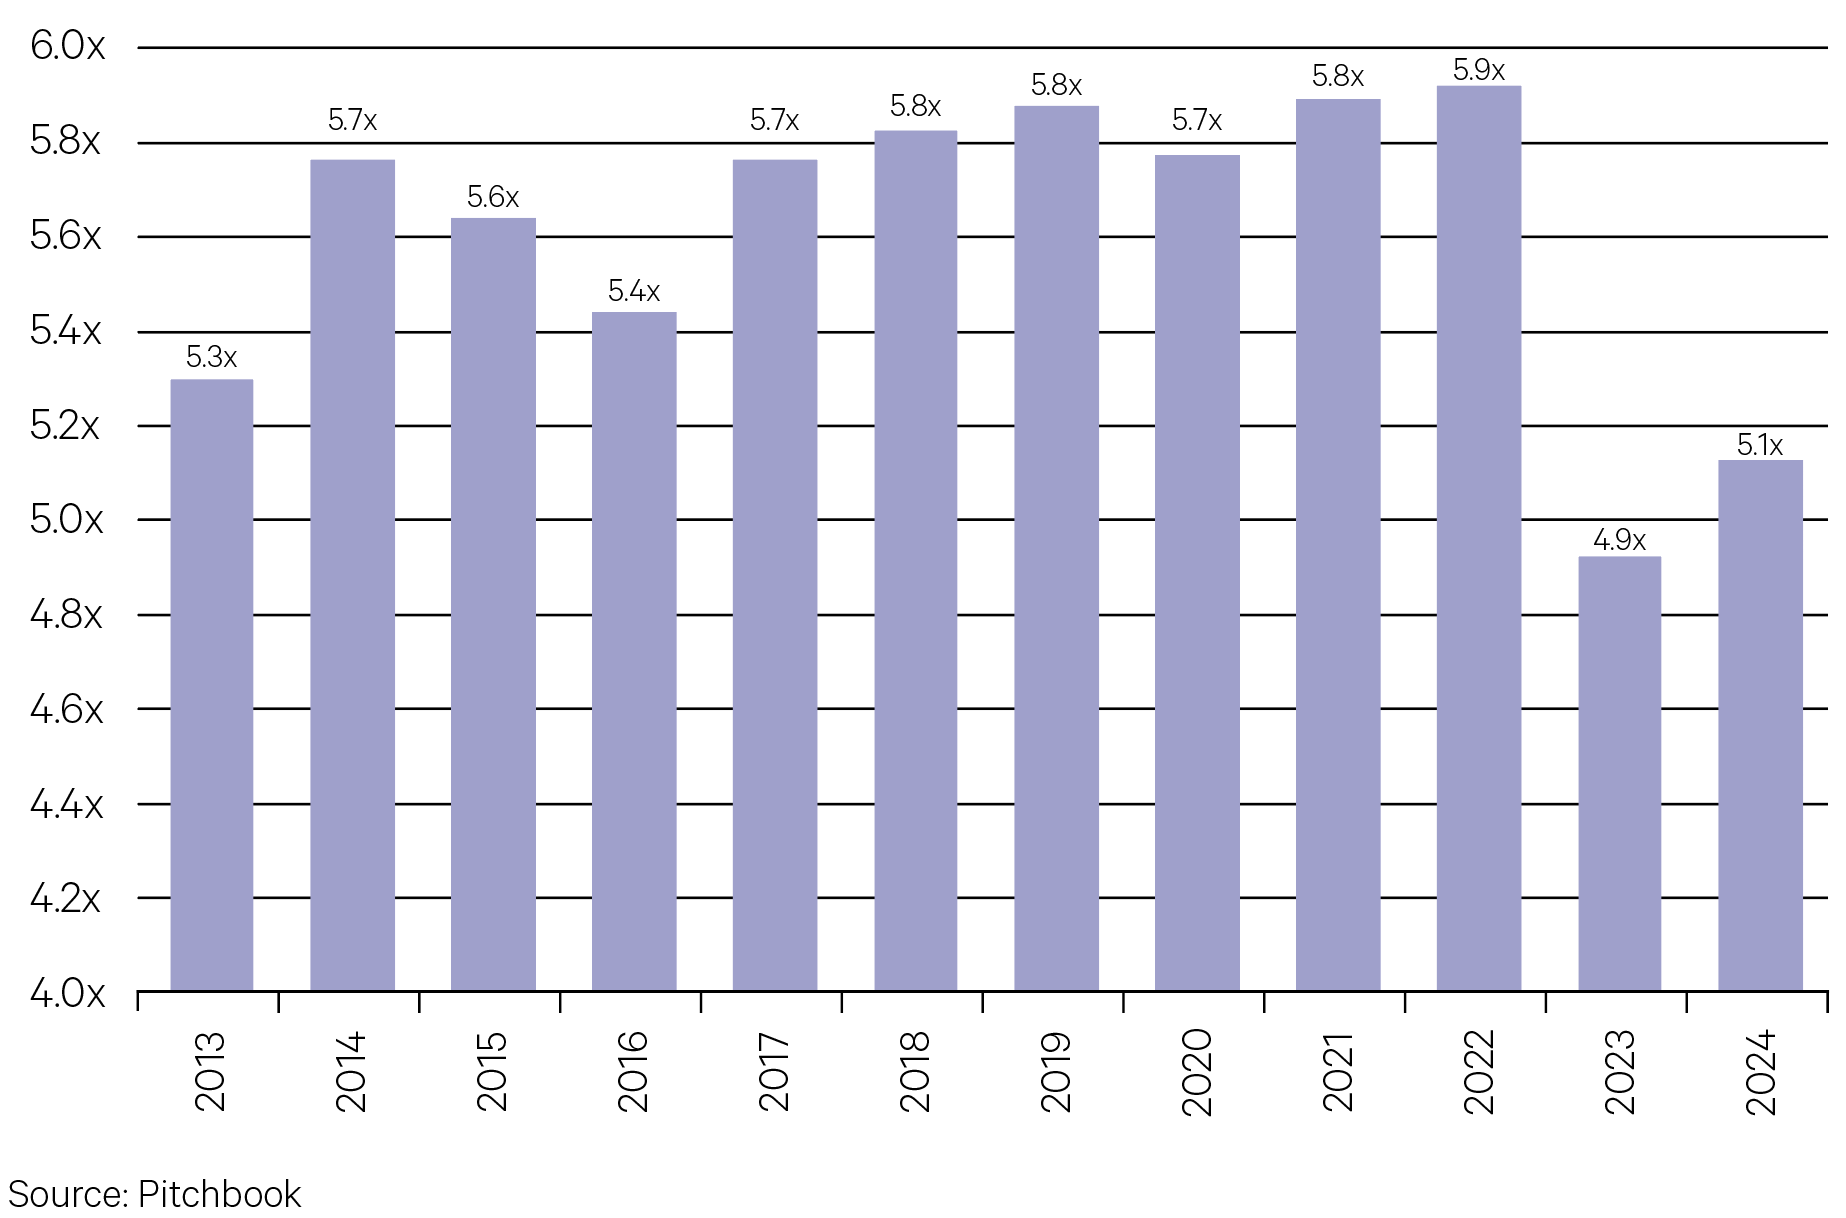
Total leverage in private markets deals has been trending lower over the past number of years. Borrowing costs for private companies have increased in recent years and as such total debt levels in companies is falling. As a result, borrowers are putting up more equity as security against their senior secured debt; this has increased from 40% a decade ago to 55% now. Private credit funds are generally taking less risk to gain a senior secured position over a private company’s assets.
Chart 11: Private credit leverage coming down (Debt / EBITDA Ratio)


Key points
Hedge Funds
-
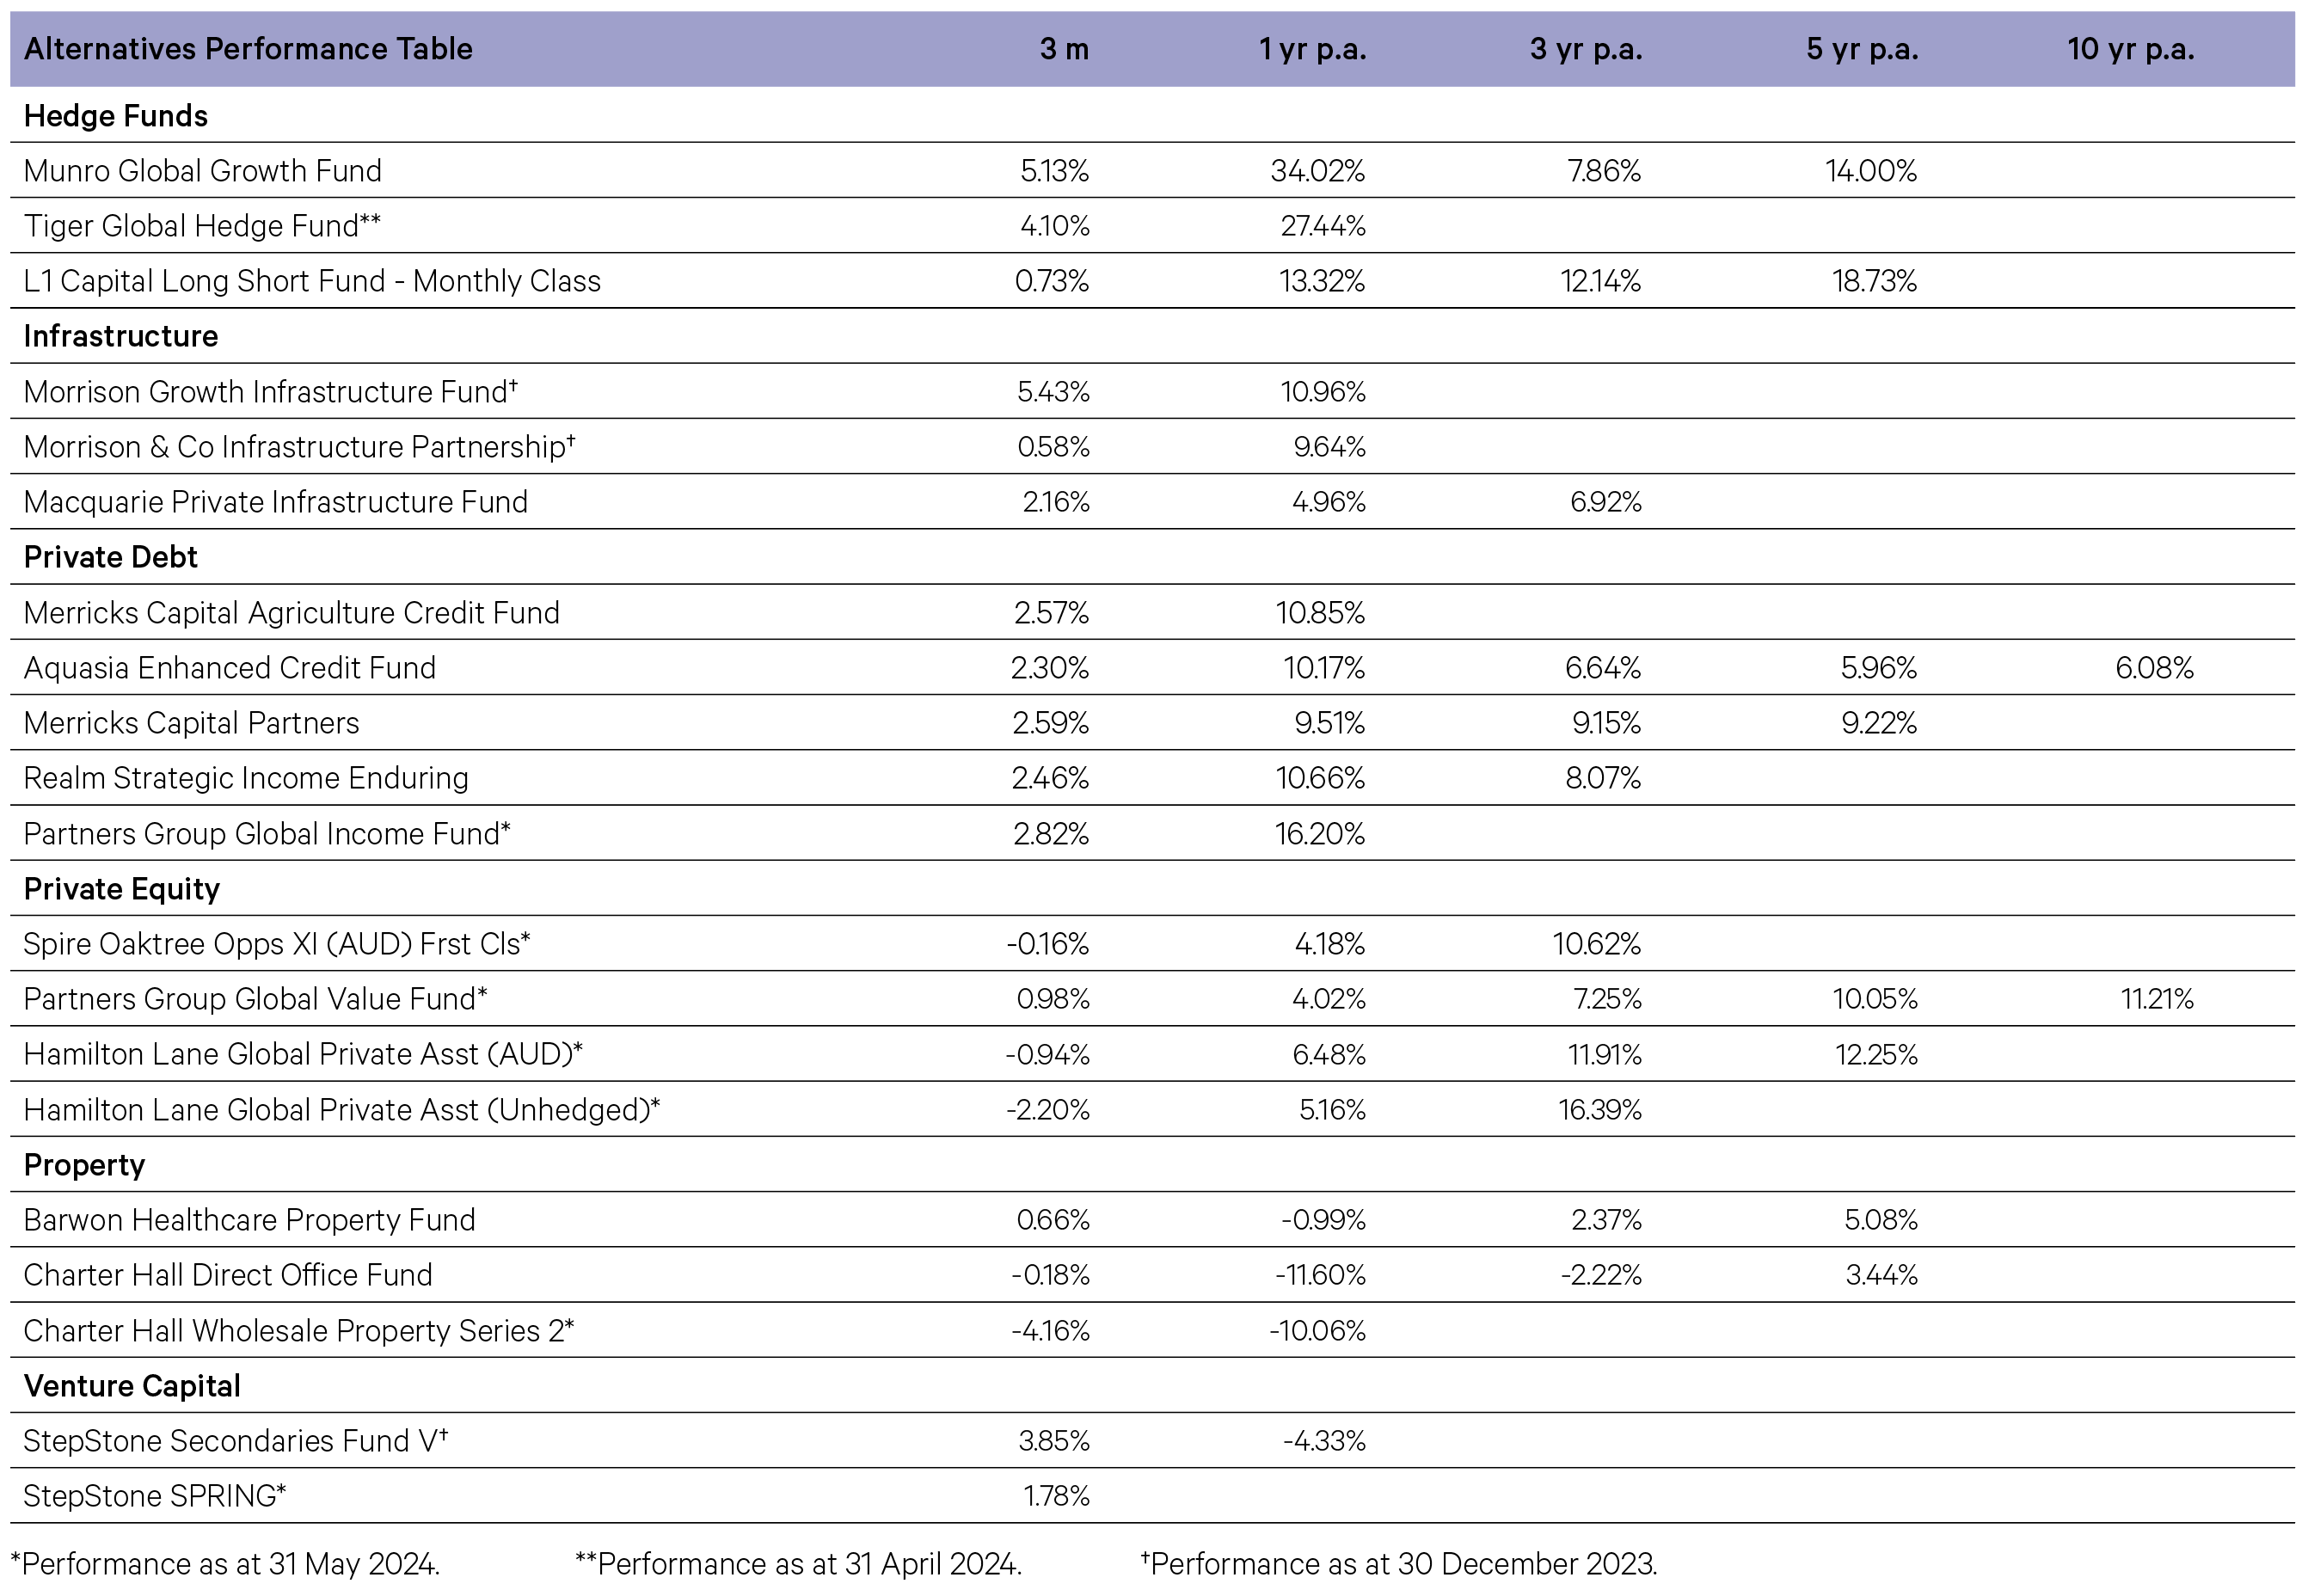
Equity long short manager Munro Global Growth added 5.1% over the June quarter. The fund’s long positions contributed positively to performance, whilst hedging and currency detracted from performance. Positive returns were driven by strong earnings from a broad range of themes and long holdings. Top contributors for the quarter included Nvidia, TSMC and SharkNinja.
Private Equity
-
Following a slow year for private equity (PE) activity, deal flow has started to come back with H1 2024 deal flow 12.0% above the same period in 2023. Mergers & Acquisitions (M&A) activity has also picked up with companies now more confident in accessing funding markets through direct lending, syndicated loans and bank lending. Exit activity for PE Funds has increased over the first half of the year and fundraising in PE markets has also picked up as sentiment improves on the industry.
-
For the three months to May-24, Partners Group Global Value gained 1% while Hamilton Lane Global Private Assets finished down 0.9%. Partners Group gained from healthcare and pharmaceuticals positions on the back of stronger earnings performance. Hamilton Lane was impacted by direct equity positions in the industrials and technology as valuations for some positions in these sectors compressed.
Private Debt
-
Merricks Partners added 2.5% estimated over the June quarter. Underlying loan income performed strongly across the quarter, with floating rate loans continuing to pass through rising interest rates in Australia and New Zealand. The portfolio currently comprises senior secured loans diversified across fourteen sub-sectors and is additionally diversified by geographic spread and borrowers. Credit default Swap (CDS) protection continues to provide the Fund with a cost-effective macro credit hedge. The Manager continues to see a strong pipeline of opportunities, focusing on residential, commercial mixed-use, mixed farming, dairy, and specialised processing assets in the agricultural supply chain.
Infrastructure
-
The Morrison Infrastructure Partnership Fund added 3.09% for the three month period to May-24 and is up 22% over the trailing twelve months. The biggest contributors were the fund’s exposure to digital infrastructure positions, specifically in the fibre industry. The Fund saw strong revenue growth across fibre businesses in Australia, North America and Europe whilst renewable energy positions also gained during the quarter.
-
The Macquarie Private Infrastructure Fund returned +2.39% over the March quarter. The fund benefitted from positive performance for the majority of its Australian focussed assets and favourable USD and EUR currency movements in relation to the fund’s international exposures. At an asset level, the fund’s aggregate Australian airports exposure was a positive contributor to returns with strong domestic passenger volumes and continued recovery of international passenger volumes across the board. The fund’s US port asset and International Transportation Service, were also notable positive contributors to their respective underlying funds.
Property
-
Commercial Real Estate (CRE) markets continue to soften as demand for areas such as office and parts of retail and logistics remain subdued. Transaction volume across all areas of CRE remain well below long-term averages, 2023 total transaction volume was 47% below the previous year. For the second quarter, Barwon Healthcare Property Fund finished up 0.66% as valuations have stabilized in the healthcare property sector. Occupancy rates across the portfolio remain high at 98% and a weighted average lease expiry of 5.1 years predominantly backed by government and ASX listed tenants.
-
