-
Gains, pains and oil gains
Investors entered the quarter optimistic that the US Federal Reserve had orchestrated a soft landing for the economy, and that the era of policy tightening would soon end. That enthusiasm withered over August and September as the prospect of a sustained period of higher interest rates sank in. The 29% rise in oil prices didn’t help.
1. Higher rates here to stay
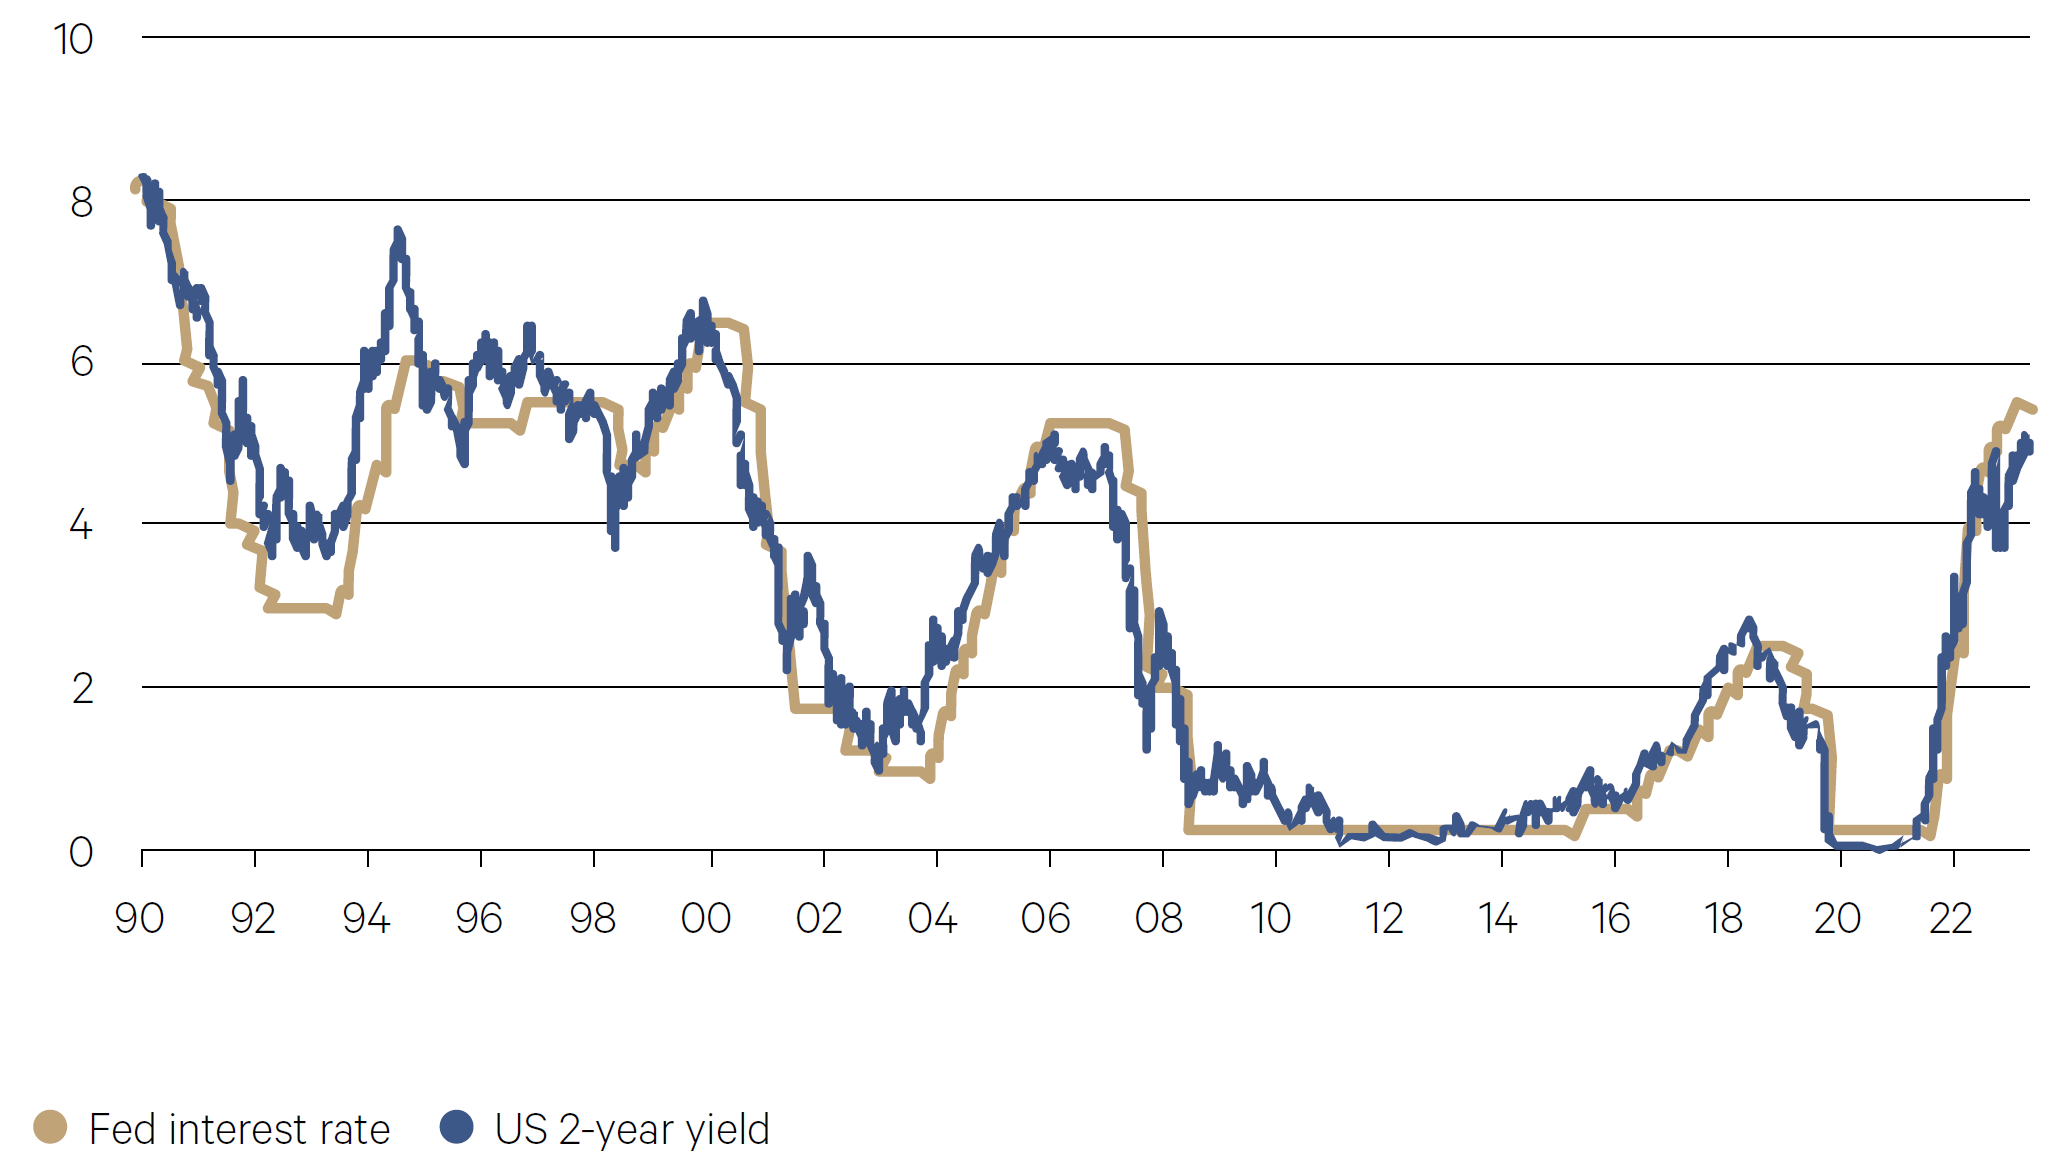
Higher rates are here to stay — that’s the message from monetary policymakers across the globe as they gathered for their annual talkfest at Jackson Hole. Federal Reserve Chair Jerome Powell said the US central bank is “prepared to raise rates further if appropriate”, while the European Central Bank President Christine Lagarde vowed to set borrowing costs as high as needed and leave them there until inflation is back to its goal. Following the comments, two-year Treasury yields – the most sensitive to policy expectations – hit the highest level since 2006.
Chart 1: US 2-year bond yield and Fed interest rate (%)

Source: Bloomberg
2. Stagflation fears for Europe and the UK
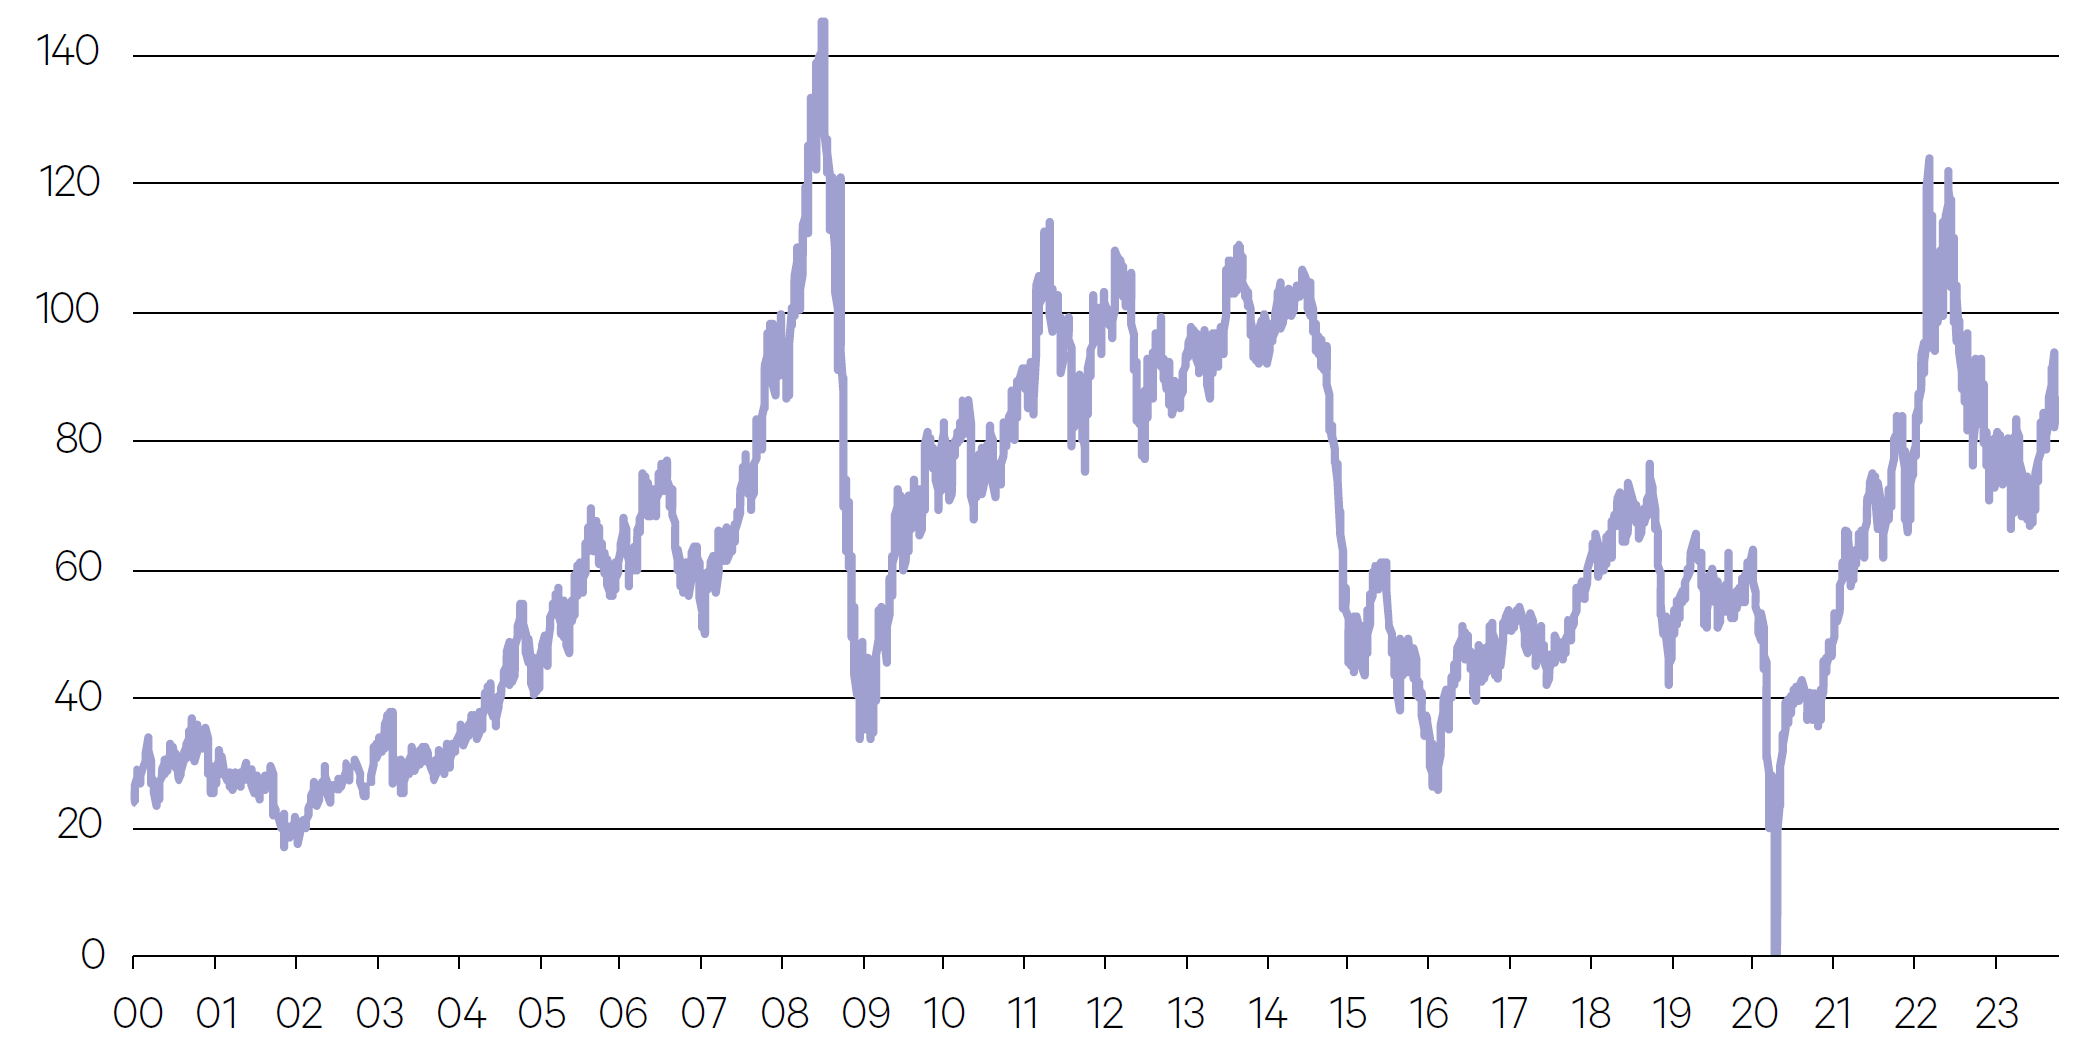
Elevated oil prices and weak economic data from Germany reignited stagflation concerns across the euro area, causing European stocks to extend their slide. The Stoxx 600 index fell 5% in the quarter. Brent crude prices approached $90 per barrel after the largest OPEC+ oil producers extended their supply cuts to year-end. The weakness in Europe and deepening signs of an economic slowdown in China also put pressure on equities in the US. The eurozone and UK are wrestling with recession risk, which markets had forgotten about three months ago.
Chart 2: Oil prices pressure inflation (USD/barrel)

Source: Bloomberg
3. China’s property-induced slowdown
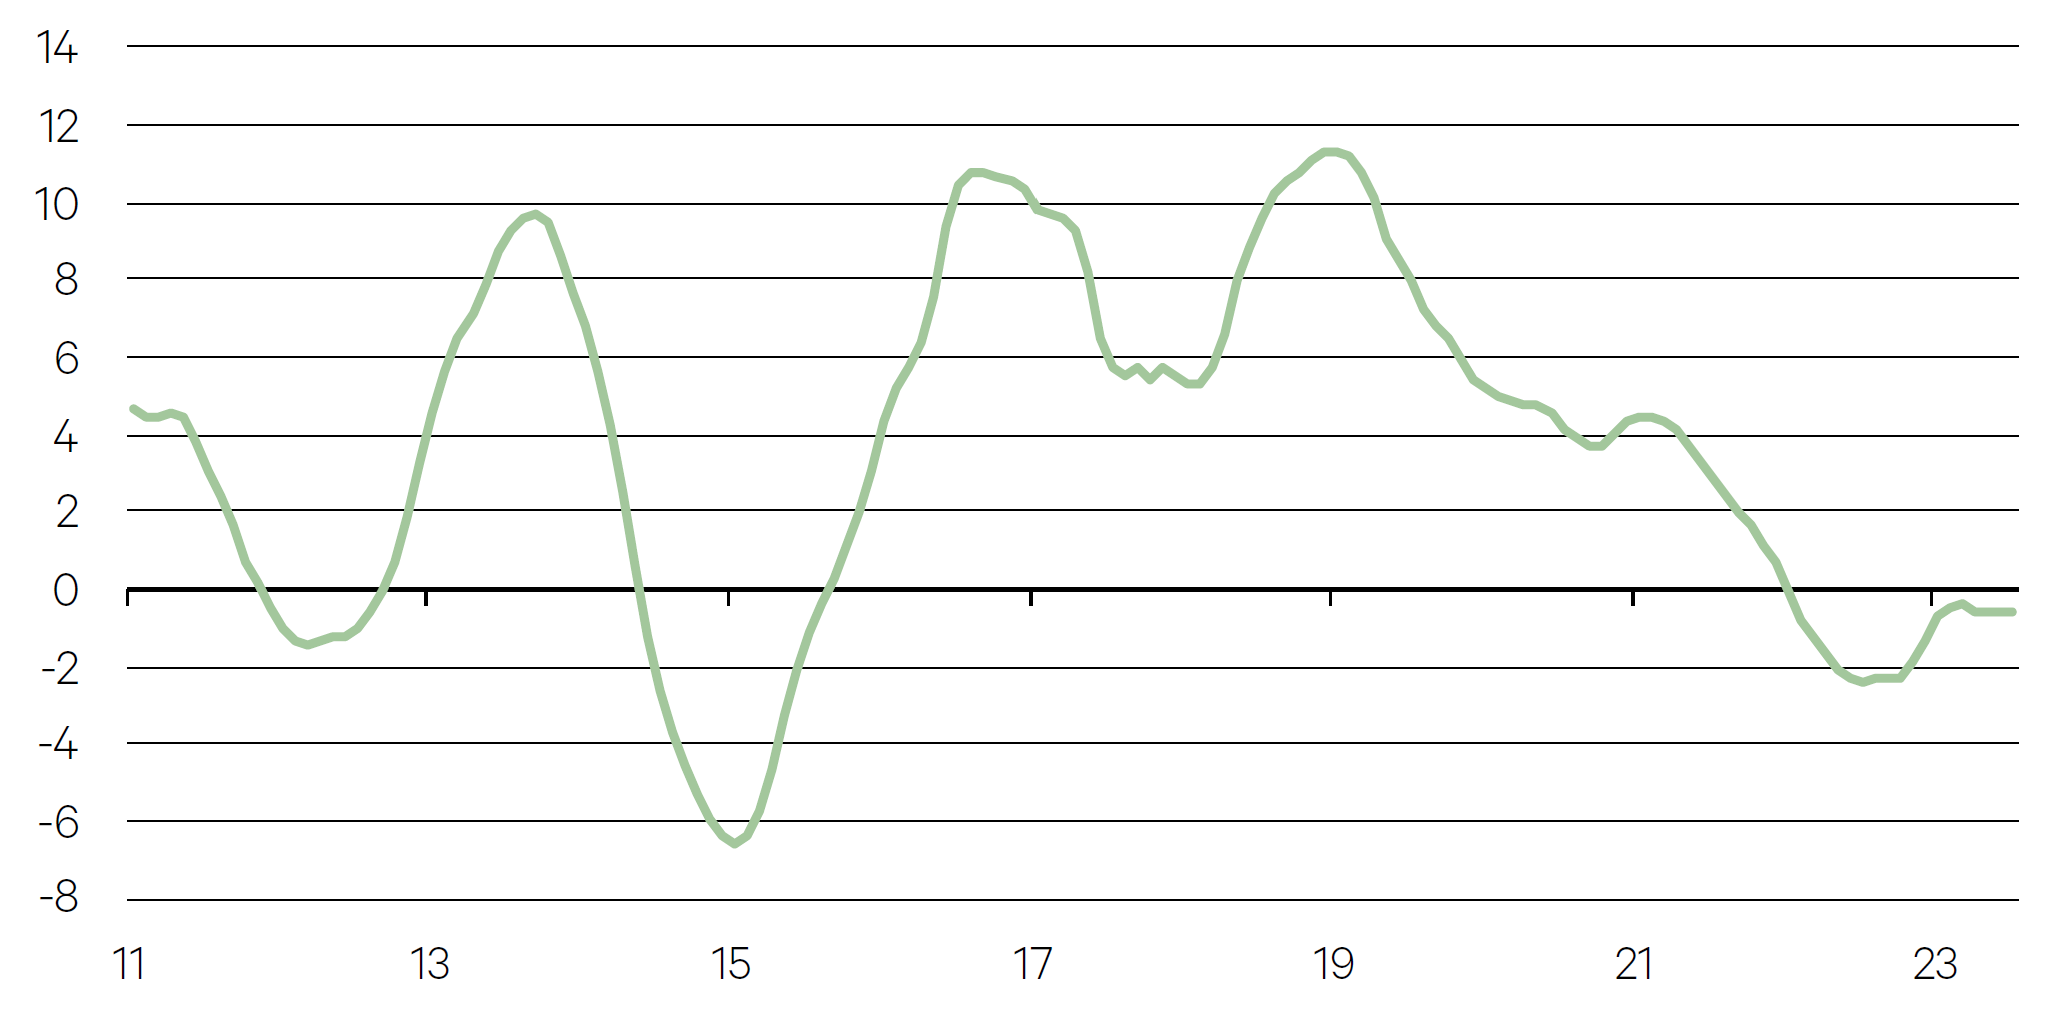
The property sector is a key part of the Chinese economy, accounting for 30% of GDP and 70% of household wealth. House prices have been on a downward trajectory, with unofficial sources indicating 15-25% slowdown in Tier-2 and Tier-3 cities. The slowdown in sales has put pressure on developer cashflows, with Country Garden, the largest developer, under bankruptcy clouds. Any further signs of stress in the property market will have a detrimental effect on consumer confidence.
Initially, investment markets expected substantial stimulus measures when signs of weakness emerged in Q2. However, during their July politburo meeting, the People’s Bank of China (PBoC) opted for more targeted fiscal stimulus across specific sectors and smaller policy measures.
The Chinese government is prioritising boosting consumer sentiment and spending over pursuing indiscriminate growth, especially given the significantly higher Chinese government debt compared to previous periods of stimulus, such as the Global Financial Crisis (77.7% of GDP vs. 29.3% in 2007).
Chart 3: Chinese house prices (yoy%)

Source: Bloomberg
-
Australian Equities

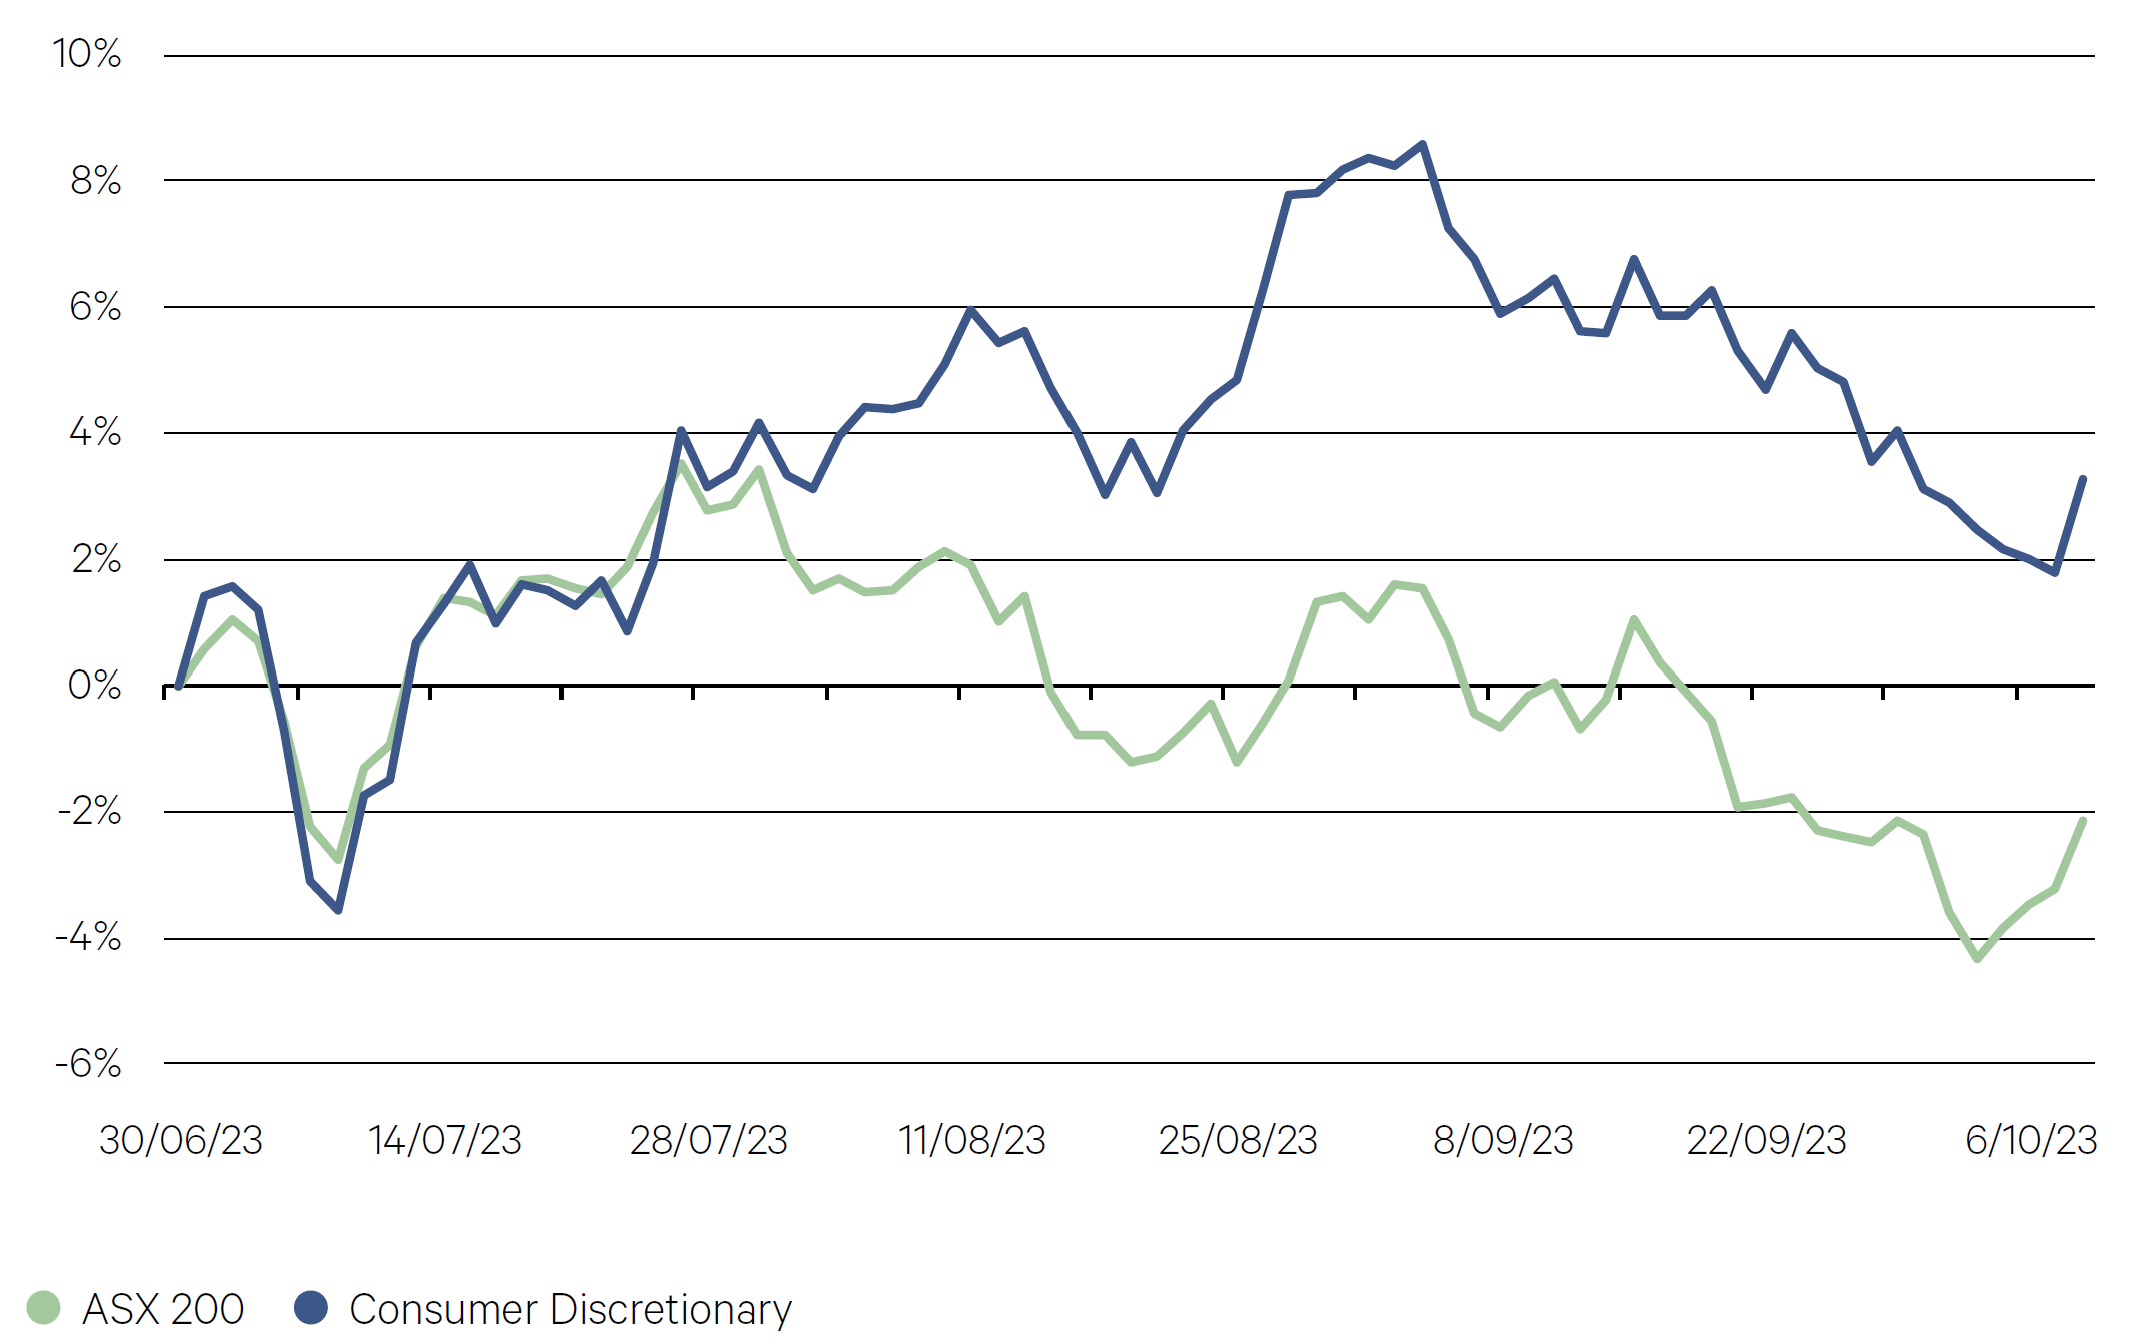
Despite a slowing demand environment with household budgets squeezed on cost of living pressures and higher mortgage repayments, the consumer discretionary sector has been one of the better performers over the last quarter. Through August,
retailers reported on softer trading conditions, though not the material drop off that some investors had been anticipating, leading to a rebound across much of the sector.Chart 4: Consumer discretionary stocks outperform in reporting season as results better than feared

Source: Bloomberg
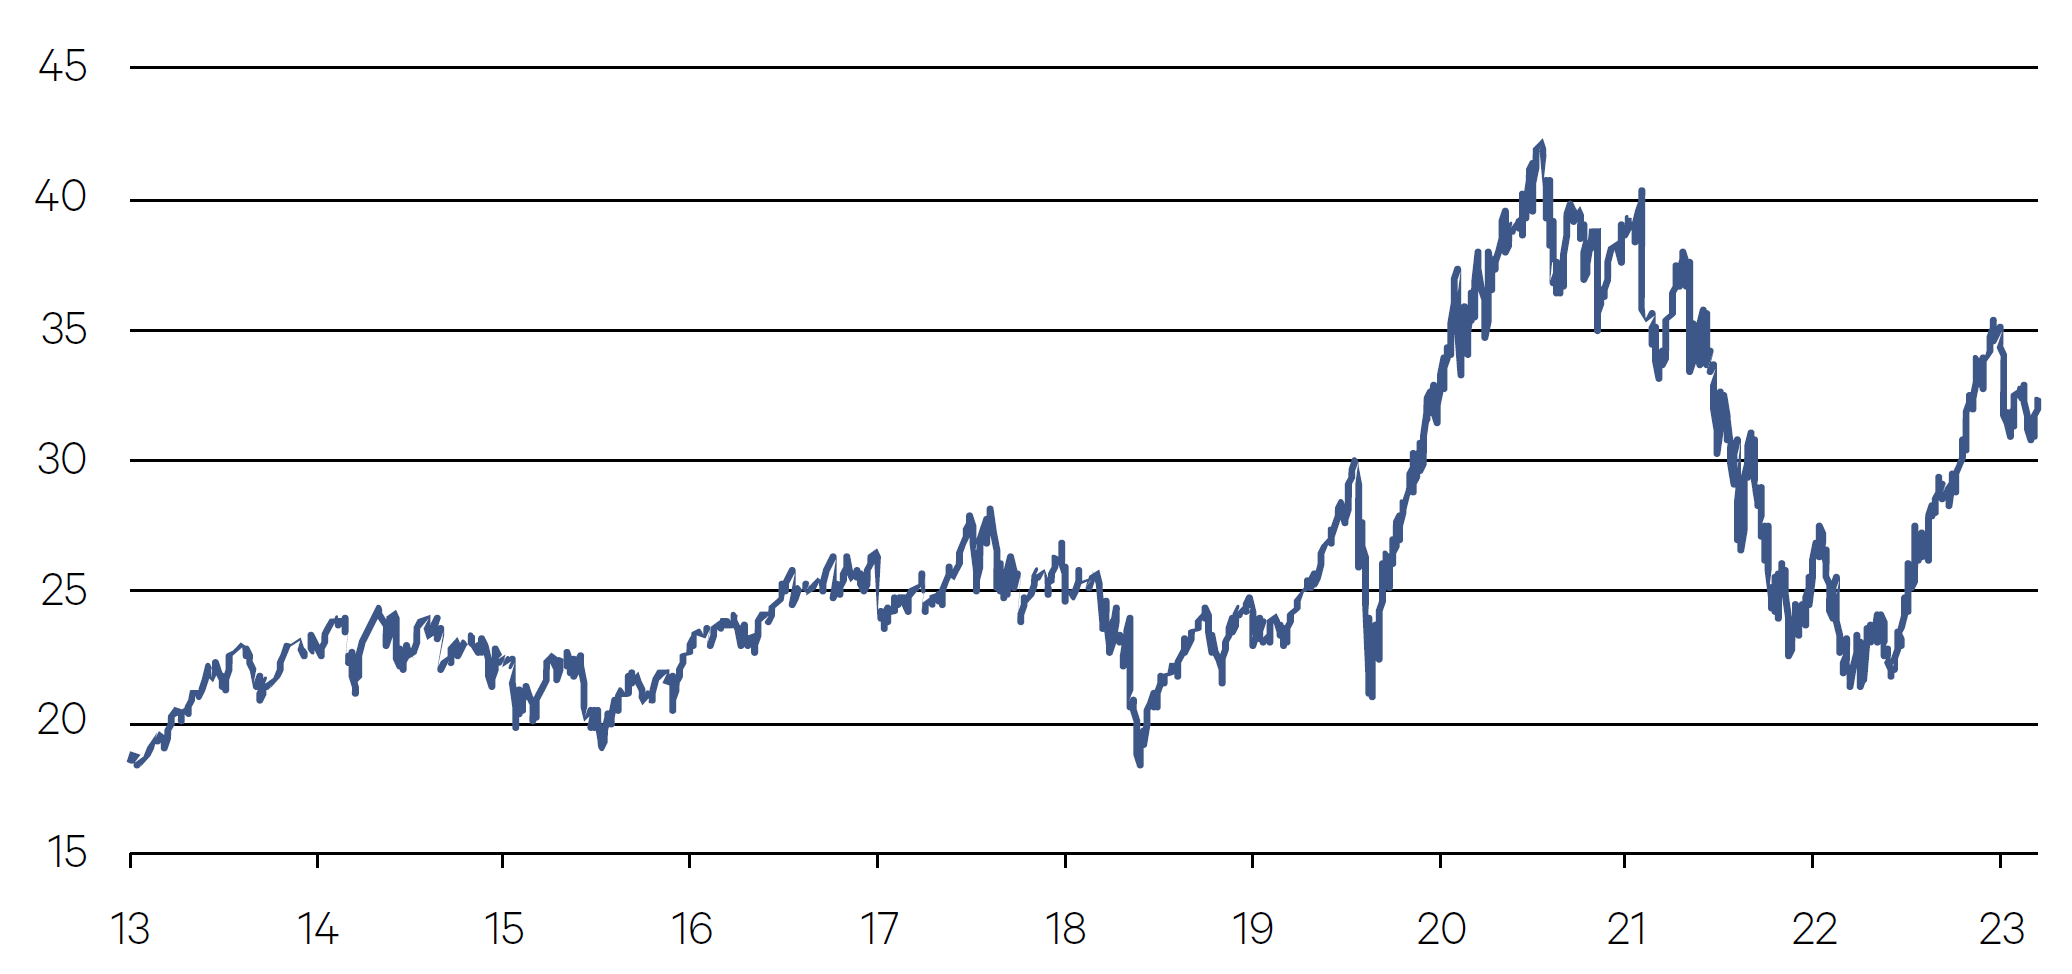
The forward dividend yield of the ASX 200 has contracted over the last 12 months, primarily due to falling dividend forecasts from the resources sector on softer commodity prices. Combined with the sharp rise in long bond yields over the last two years, the Australian 10 year government bond yield is now in line with the forward yield of the ASX 200 Index, challenging the argument for investing in domestic equities for income. The yield premium on the domestic equity market had been in place for the last 12 years, averaging close to 2% over that period.
Chart 5: ASX 200 forward dividend yield now in line with long bond yields

Source: Bloomberg

- After a strong start to the financial year in July, the Australian equity market lost ground over August and September to finish slightly lower over the quarter.
- August’s full year reporting season was a key driver of individual stock performance in the quarter, with a high level of price volatility following the release of company results. On aggregate, full year results were reasonable amid a backdrop of tighter financial conditions, however the dual headwind of higher labour and interest costs was a key takeaway. While results were largely
in line with expectations, analyst downgrades to FY24 profit forecasts highlighted the more challenging environment for the next 12 months. - The Australian market also could not escape the key macroeconomic driver of a further rise in long bond yields in response to economic data that has continued to surprise in a positive manner. This led to a derating in P/E multiples, particularly for longer-duration growth sectors of health care and IT, which underperformed in September.
- The sharp rebound in the oil price was another key driver for the market, which led to energy leading the way from a sector perspective.
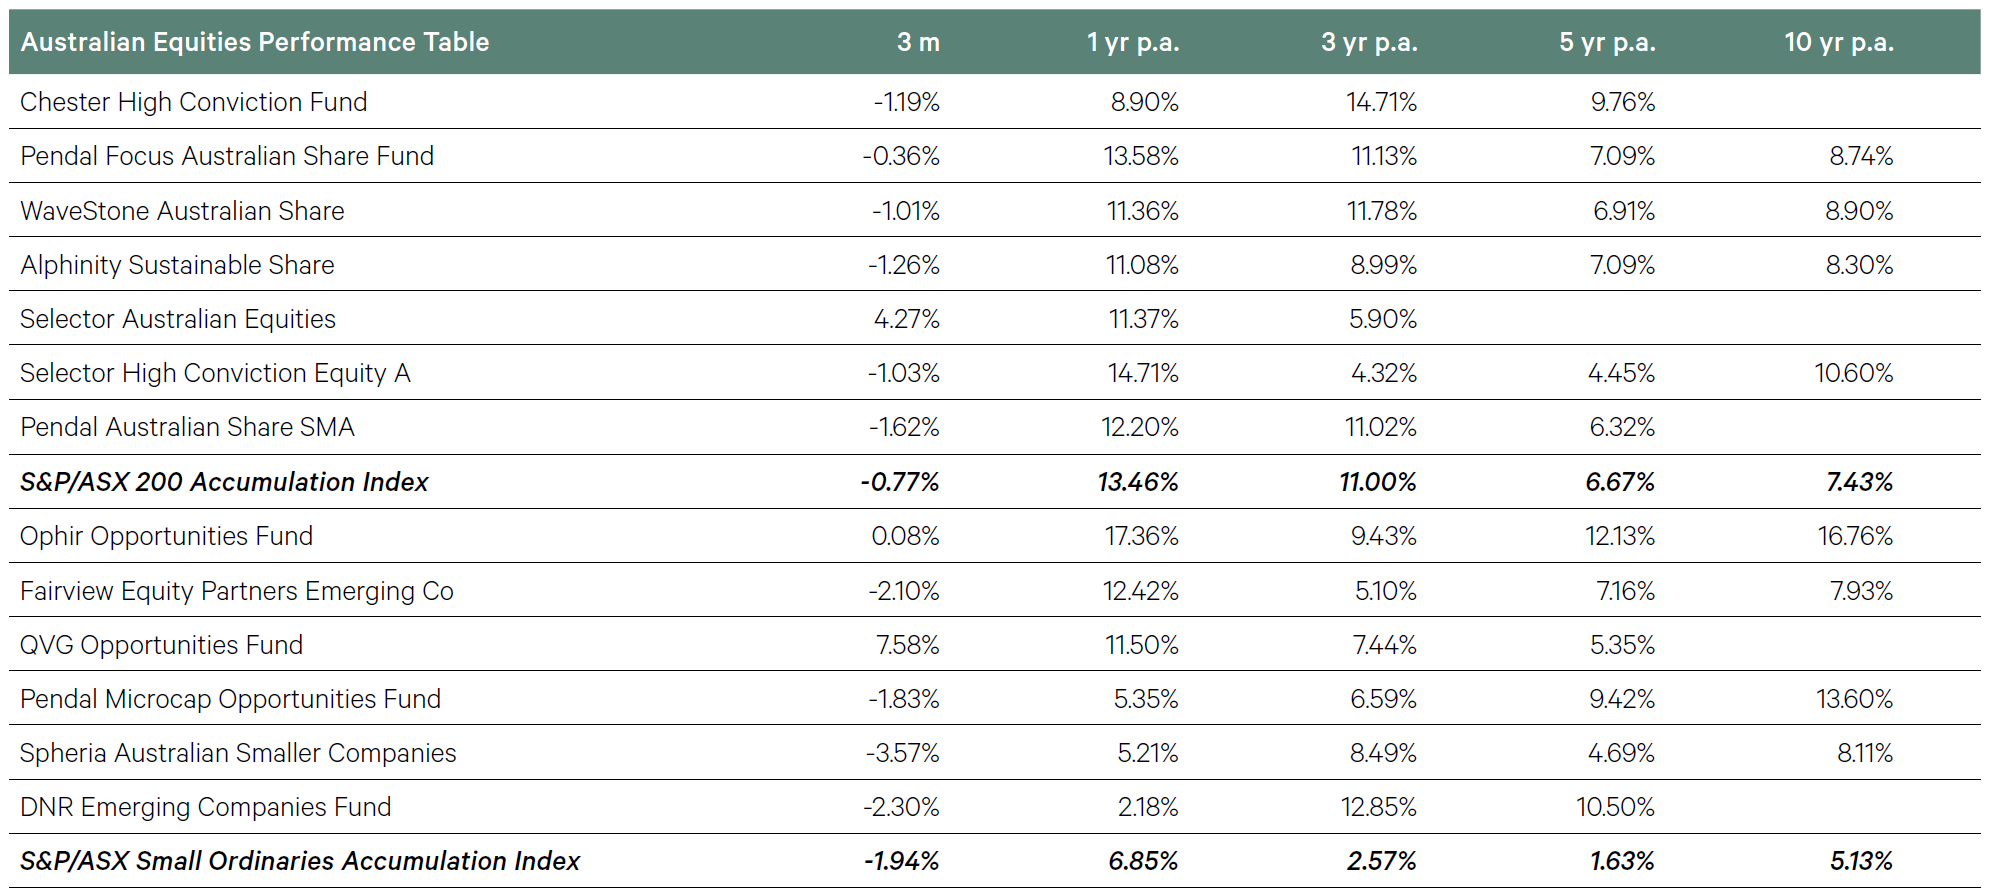
- For the quarter, our large cap managers generated returns that were broadly in line with the benchmark ASX 200 Index. The performance of our more growth-oriented managers, Selector and WaveStone, was commendable given the headwind of rising interest rates.
- Small caps underperformed large cap Australian equities and now trail large caps by more than 6% over the last 12 months.
- Spheria Smaller Companies was a slight laggard compared to the benchmark, though the standout was QVG, which outperformed the Small Ords Accumulation Index by 9.5%. QVG’s returns were on the back of an exceptionally strong reporting season in August, with solid attribution from the fund’s largest holdings in the month.
-
International Equities

The tech-heavy Nasdaq 100 has dropped 5.8% in September, a backto-back loss and its worst monthly showing of 2023, as high-flyers such as Tesla Inc. and Microsoft Inc. stumble. Even with the pullback, the index is trading at more than 31 times annual earnings – lower than the halcyon days of 2021, but higher than almost any point in the past decade.
Chart 6: Lofty tech valuations – Nasdaq PE (annual earnings multiple)

Source: Bloomberg
The approach of crude toward $US100 a barrel is presenting central bankers with a reminder that the era of volatility heralded by the pandemic and war in Ukraine isn’t going away. Brent crude has reached a 10-month high around $US95 a barrel as export curbs by Saudi Arabia and Russia combined with an improving outlook for the US and China to drive prices higher. For central bankers, such commodity spikes can be an immediate red flag as it pressures inflation higher.
Chart 7: Oil prices pressure inflation (USD/barrel)

Source: Bloomberg

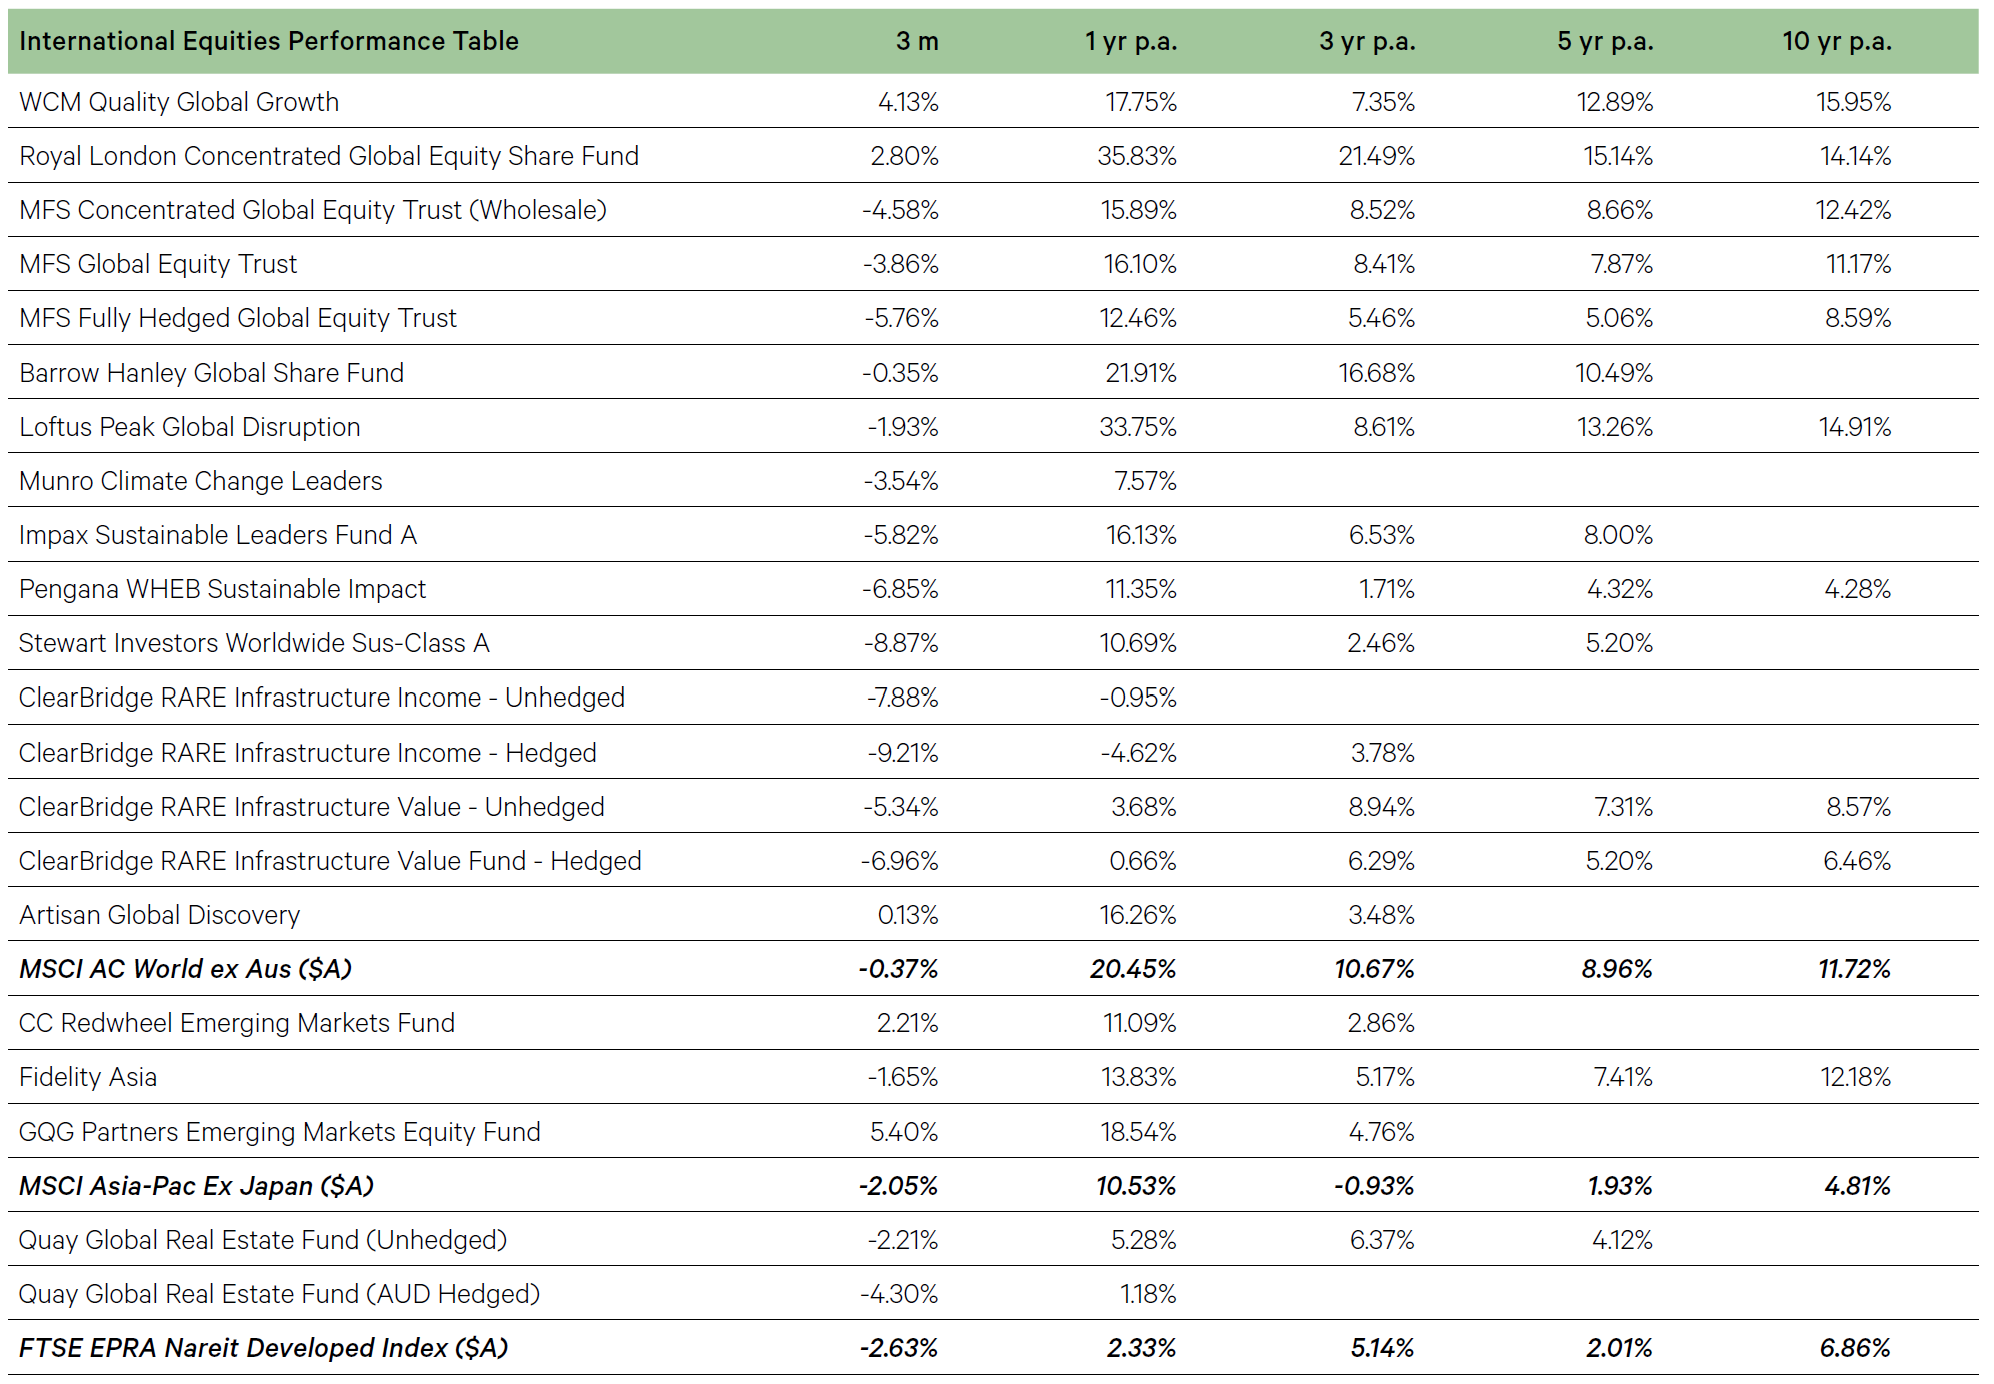
- The MSCI World Index fell by 3.8% in the quarter. The S&P 500 index finished the quarter down by 3.6% while the Nasdaq fell 4.1% after gaining 12.8% and 16.8% in Q2 and Q1 respectively. European shares again underperformed the US with the Euro Stoxx index down by 5.1%. Energy was by far the bestperforming
sector and the only one that increased over the quarter. Utilities, on the other hand, trailed, hurt by higher bond yields. - Emerging market (EM) equities were down 3.7% over the quarter led by a 4.3% slump in Chinese equities and a 5% drop in Mexico. China’s growth recovery remains weak and policy measures remain small and targeted. This has particularly affected our Asian equities fund Fidelity.
- The Australian dollar fell 3.4% against the US dollar, euro and to a lesser extent the Japanese yen. Our currency was up against the UK pound. Global funds that were unhedged therefore benefited.
- The rise in bond yields over the quarter weighed on performance. This was particularly the case for our more growth-oriented funds such as Stewart Investors and for our infrastructure funds, where the allocation to utilities is high, such is the case with ClearBridge.
- Stewart Investors largest holding in the quarter was Fortinet, a company that provides cybersecurity solutions and services. The company fell by 22% in the quarter on signs IT budgets are being reallocated toward artificial intelligence spend and away from cybersecurity.
- The MSCI World Index fell by 3.8% in the quarter. The S&P 500 index finished the quarter down by 3.6% while the Nasdaq fell 4.1% after gaining 12.8% and 16.8% in Q2 and Q1 respectively. European shares again underperformed the US with the Euro Stoxx index down by 5.1%. Energy was by far the bestperforming
-
Fixed Income

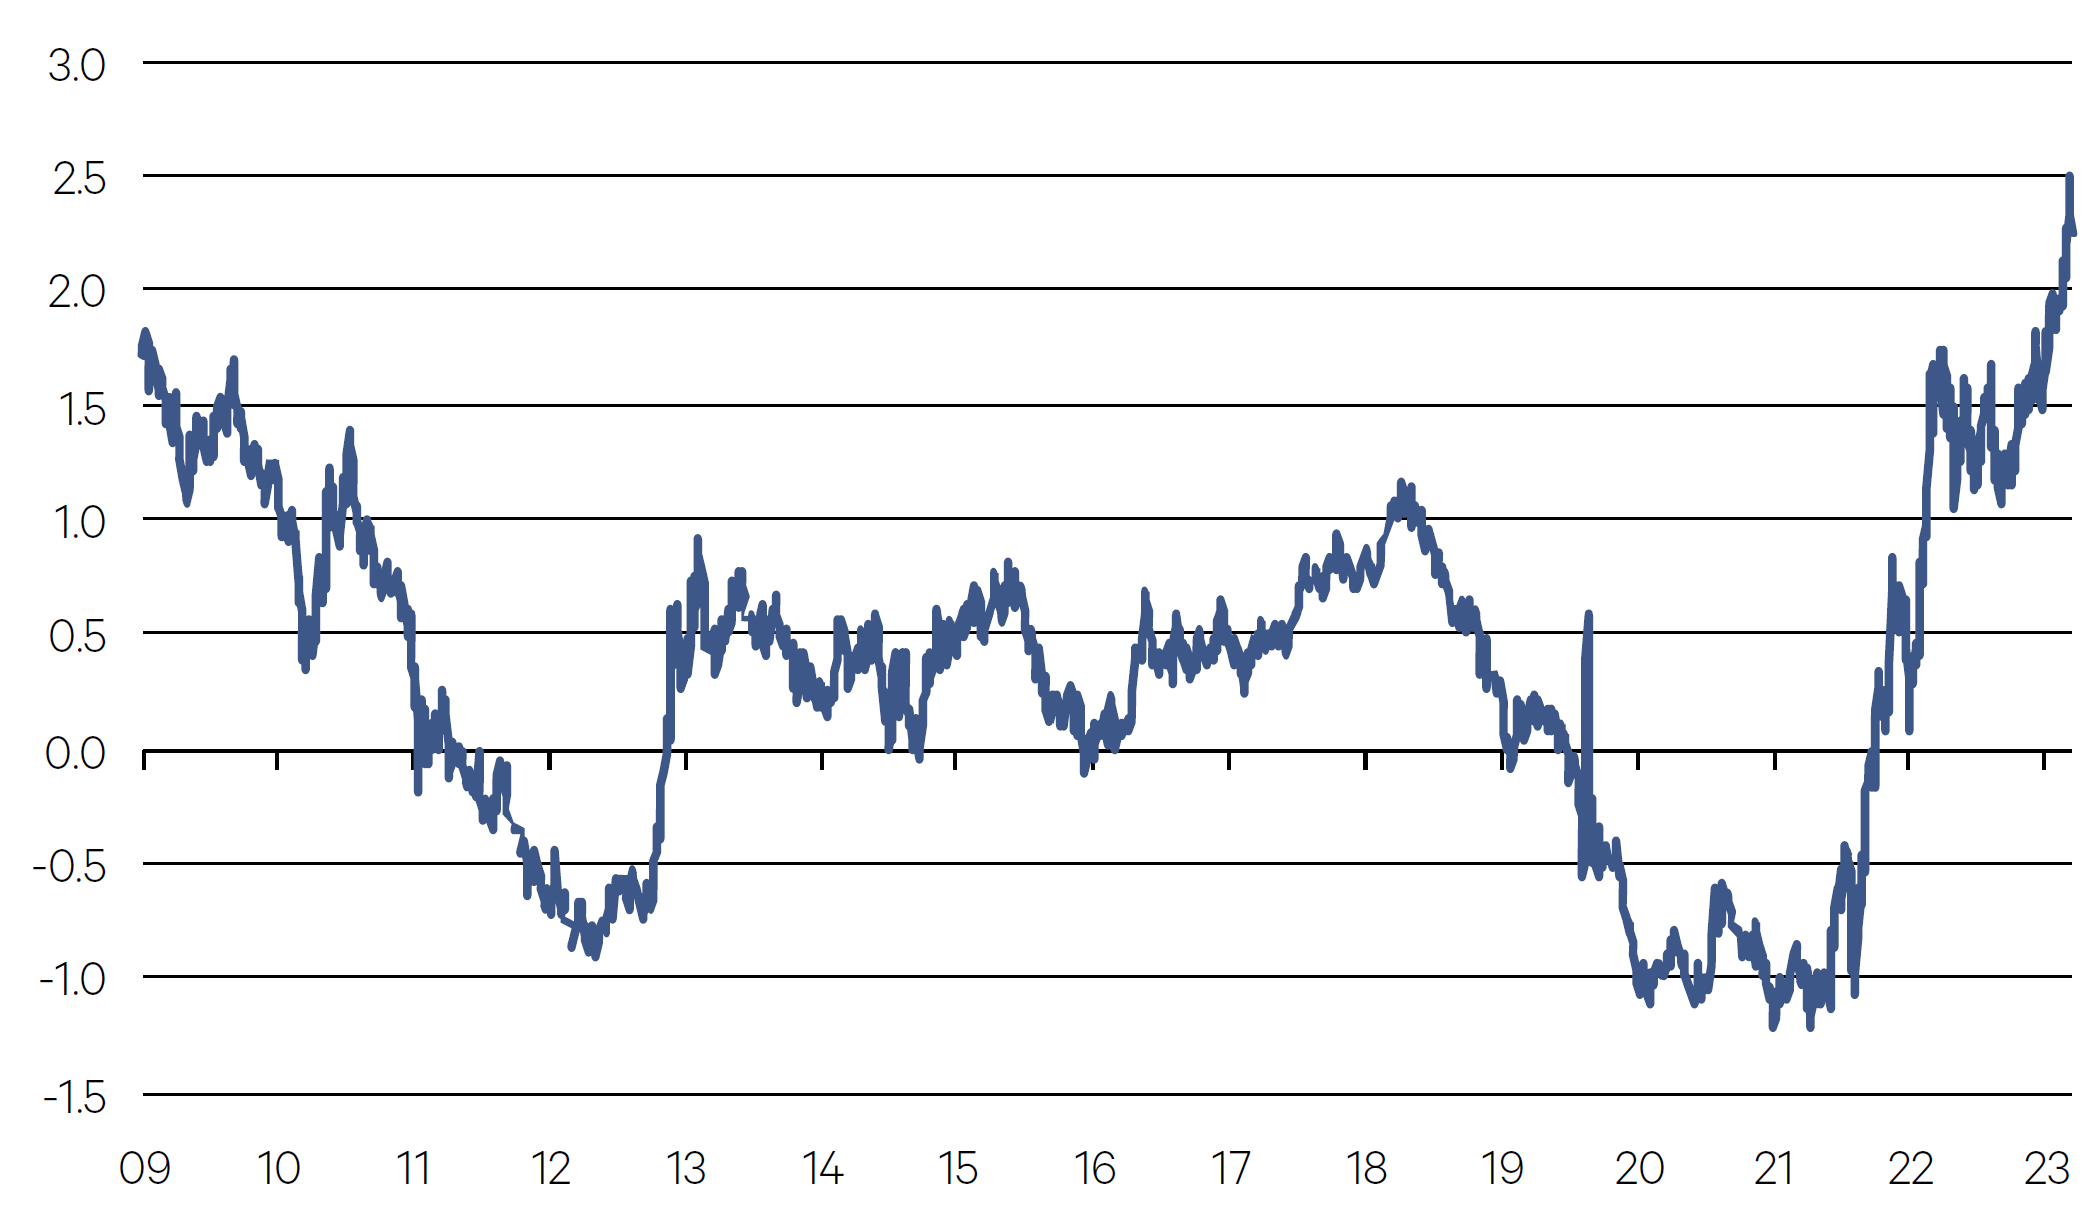
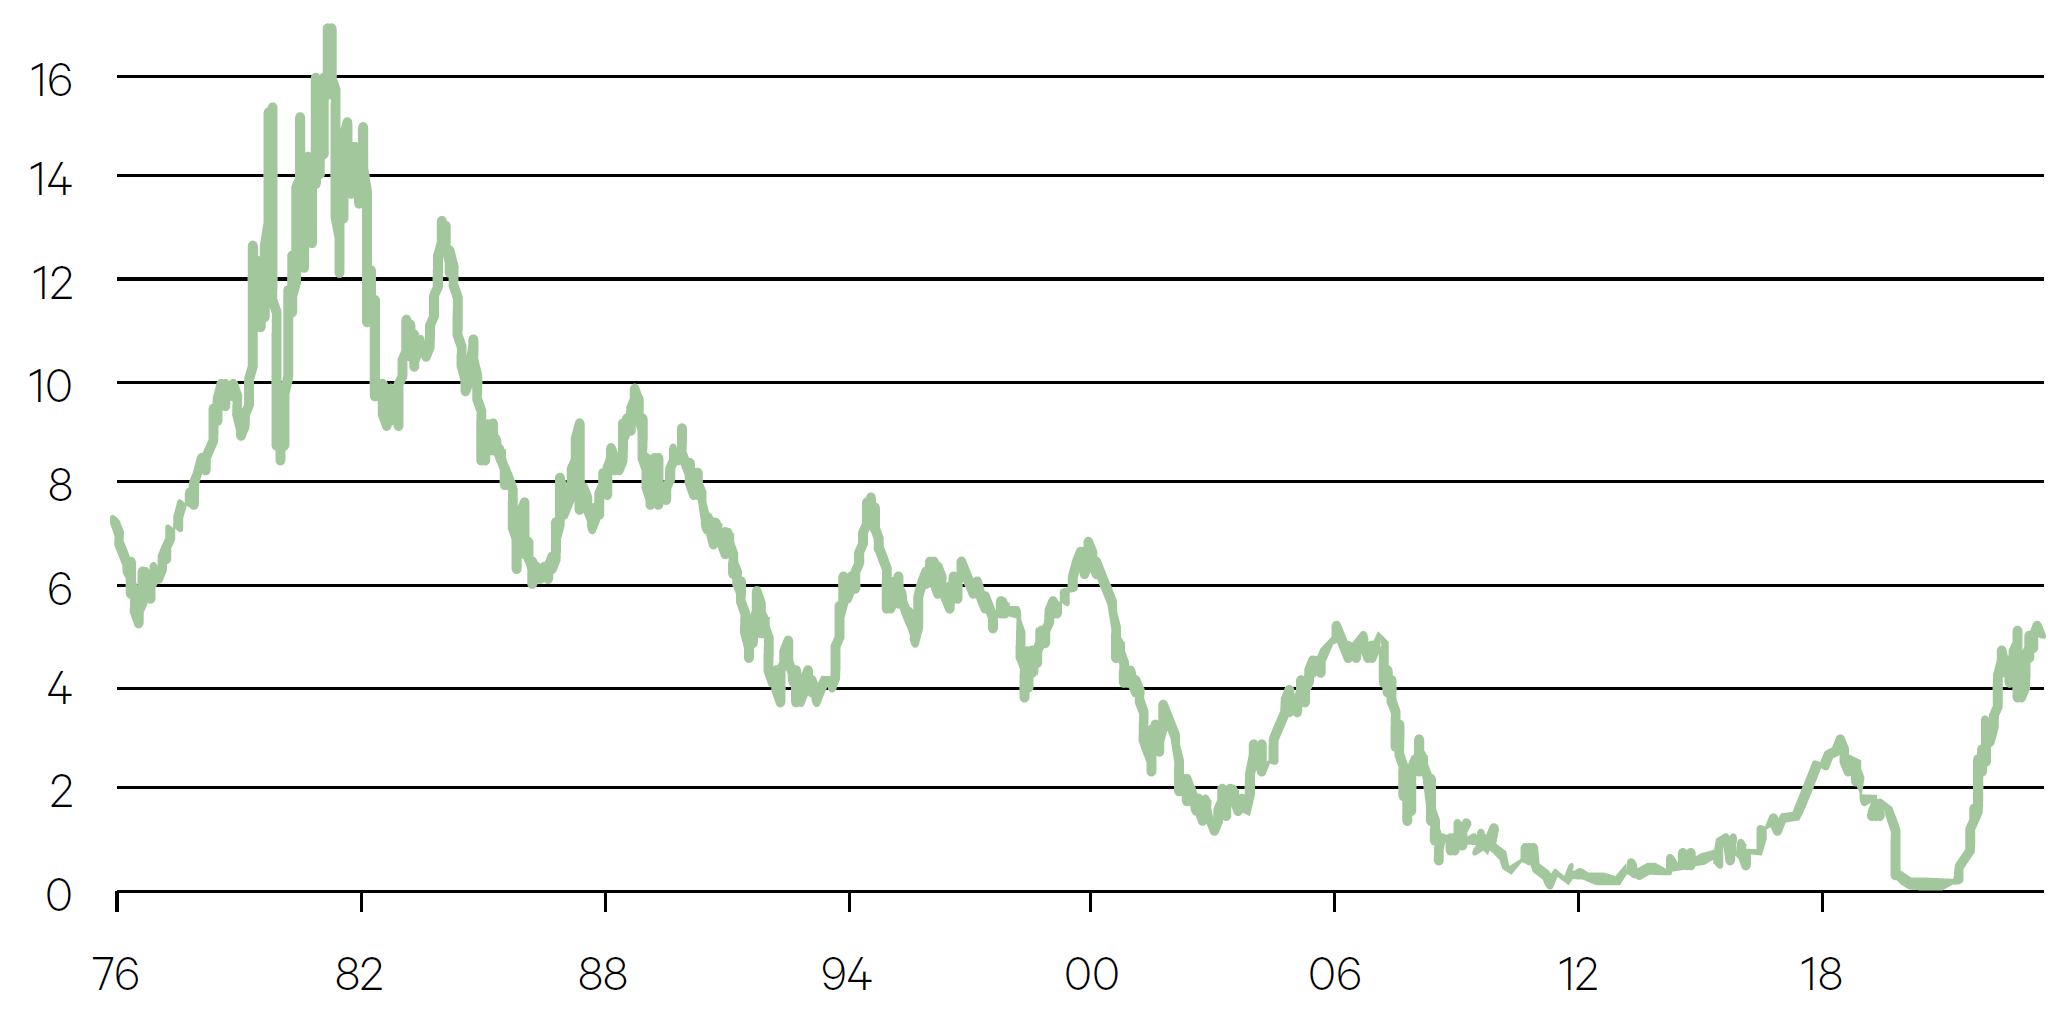
Benchmark 10-year real rates climbed to the highest level since 2009 in the quarter. Sustainably high real rates serve to tightening financial conditions – an oft-stated goal of the US Federal Reserve Chairman. More expensive funding costs increase the cost of doing business and put pressure on the likes of technology shares because their long-term earnings prospects now have to be discounted at higher rates. At the same time assets that lack income streams like cryptocurrencies look less appealing given the opportunity costs to hold them compared to a Treasury bond that pays out a real return.
Chart 8: Real yields soar (%)

Source: Bloomberg
While individuals are piling into cash, for many portfolio managers the debate now is about how far to go in the other direction. Two-year bond yields above 5% haven’t been this lofty since 2006, while 10-year yields eclipsed 4.5% for the first time since 2007. Is it time to buy longer dated bonds?
Chart 9: 2-year yields highest since 2006 (%)

Source: Bloomberg

- Government bond yields rose in the quarter, mostly in September, and yield curves steepened as short-term rates rose less than longer term yields. This reflected the resiliency of the economic data coming out of the US in particular. This had a negative impact on the funds that had a high allocation to duration
such as WAM Australian Bond Fund and the PIMCO Global Credit Fund. - 10-year government bond yields rose by 46 basis points in Australia, on still high inflation, and by 73 basis points in the US – the largest quarterly jump in a year. The US Federal Reserve raised rates once over the quarter, taking the official interest rate to 5.5%. Germany’s 10-year bond yield rose to 2.8%, its highest in 12 years. Japan’s bond yield nearly doubled to the highest since 2013, albeit to just 0.76%.
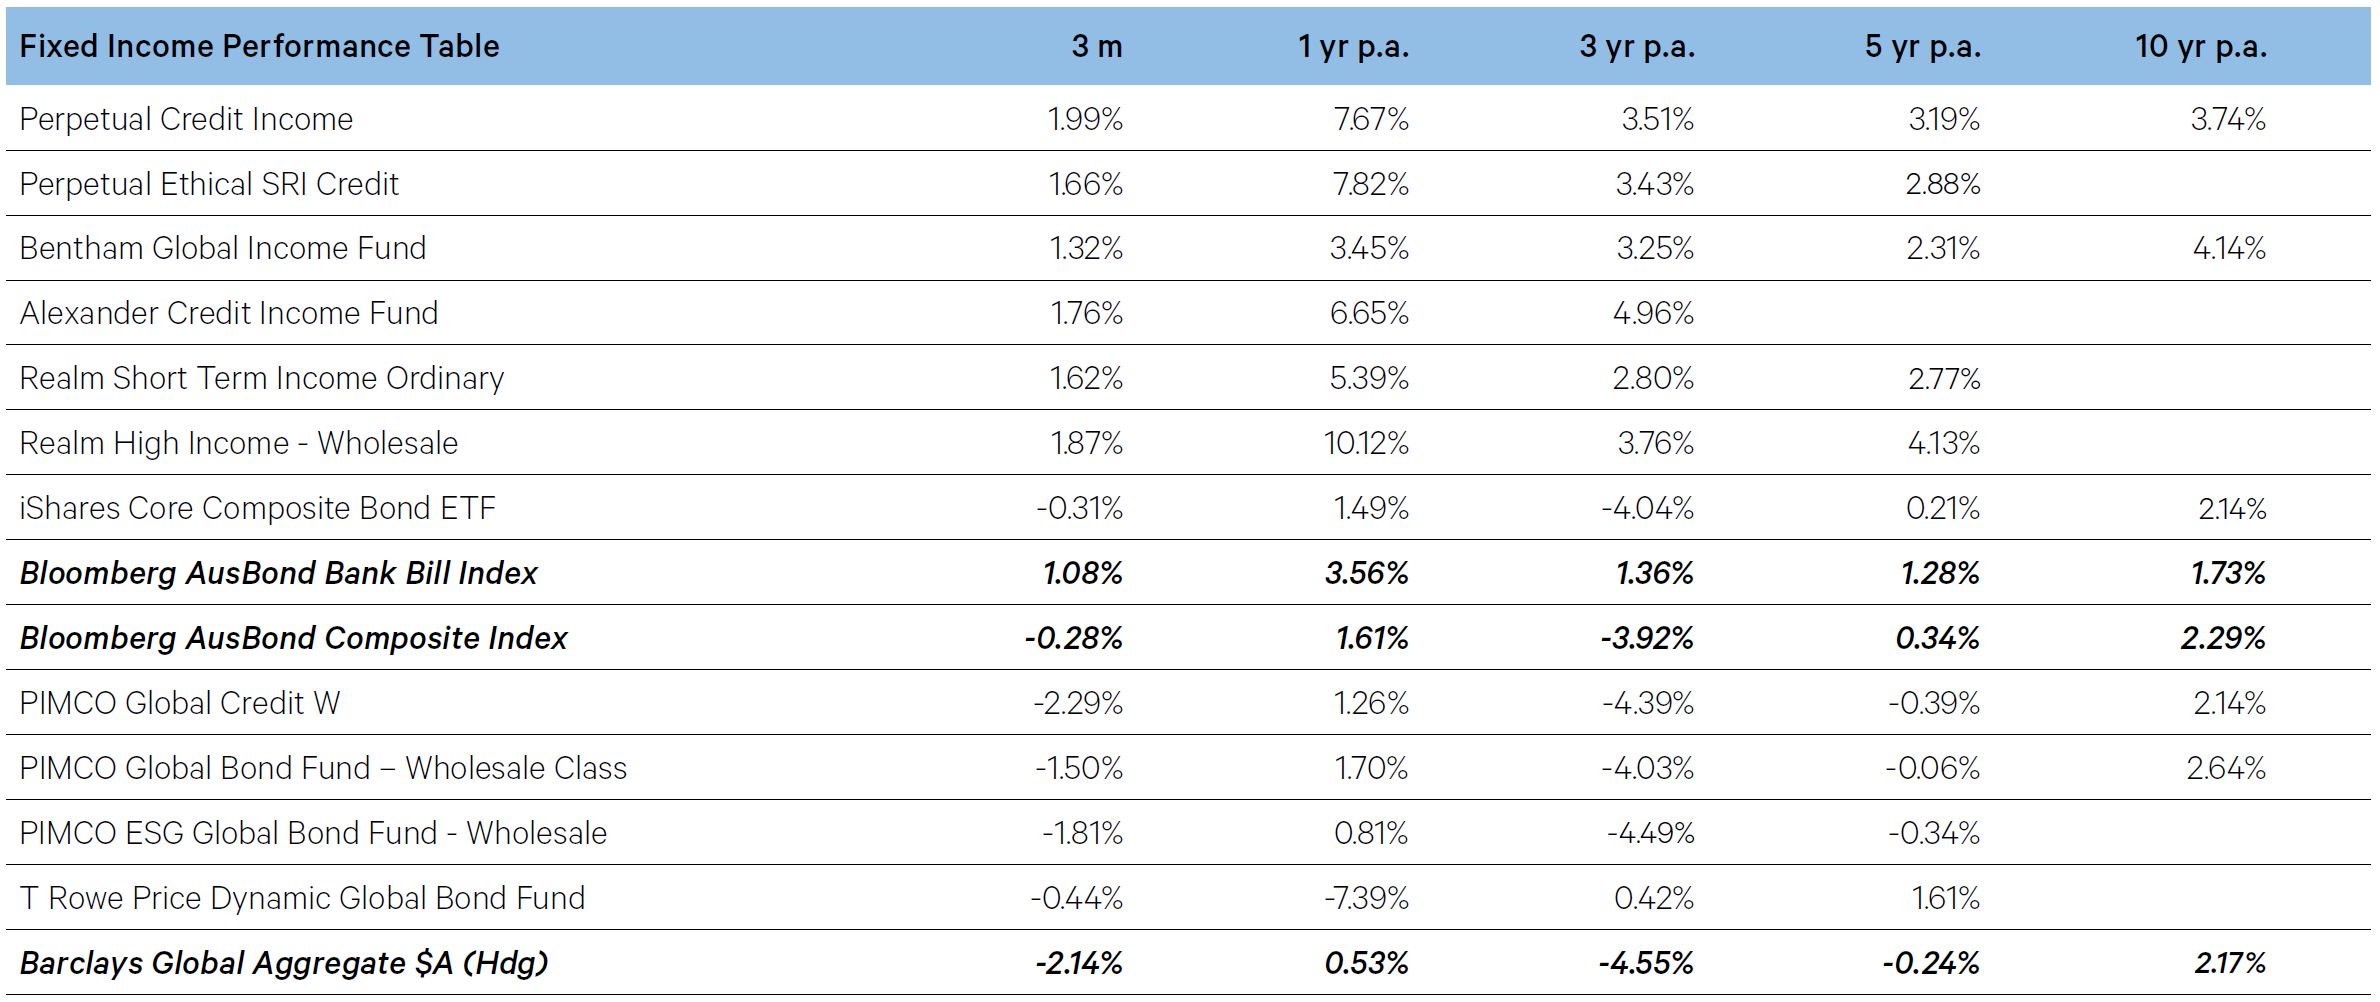
- The increase in yields weighed on investment grade credit where duration risk is higher. In contrast, high yield credit benefited from higher yields. The rise in yields benefited our floating rate credit funds such as Perpetual Credit Income and the Realm High Income Fund.
- Our liquidity funds, Realm and Alexander, performed in-line with expectations for the quarter.
- Government bond yields rose in the quarter, mostly in September, and yield curves steepened as short-term rates rose less than longer term yields. This reflected the resiliency of the economic data coming out of the US in particular. This had a negative impact on the funds that had a high allocation to duration
-
Alternatives

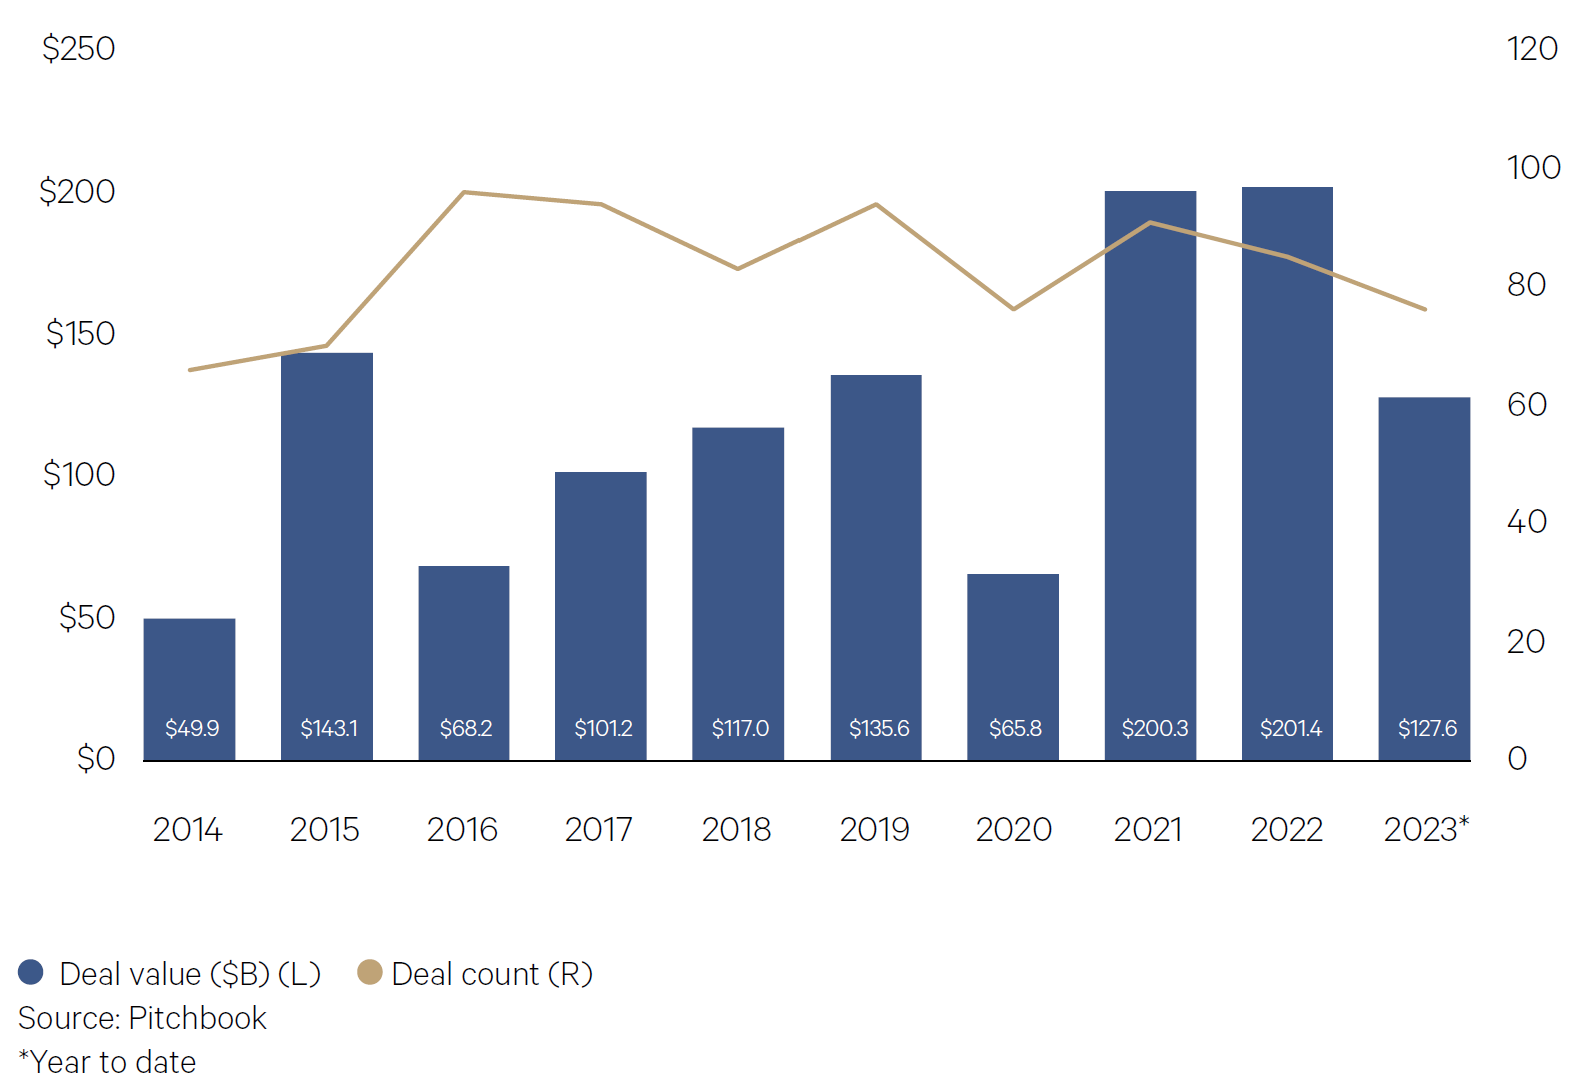
With heightened public market volatility throughout recent years, more and more companies are moving toward private markets. Declining public market valuations and the rise of private credit funding sources has enabled PE funds to hunt for opportunities in public companies at depressed valuations. Year to date there has already been 76 take private transactions with total value of take private transactions on track to exceed $150 billion for the third straight year. Notable take private examples in 2023 include Weber Inc.’s deal with BDT Capital worth $3.7bn.
Chart 10: Private Equity take privates on track to exceed $150bn

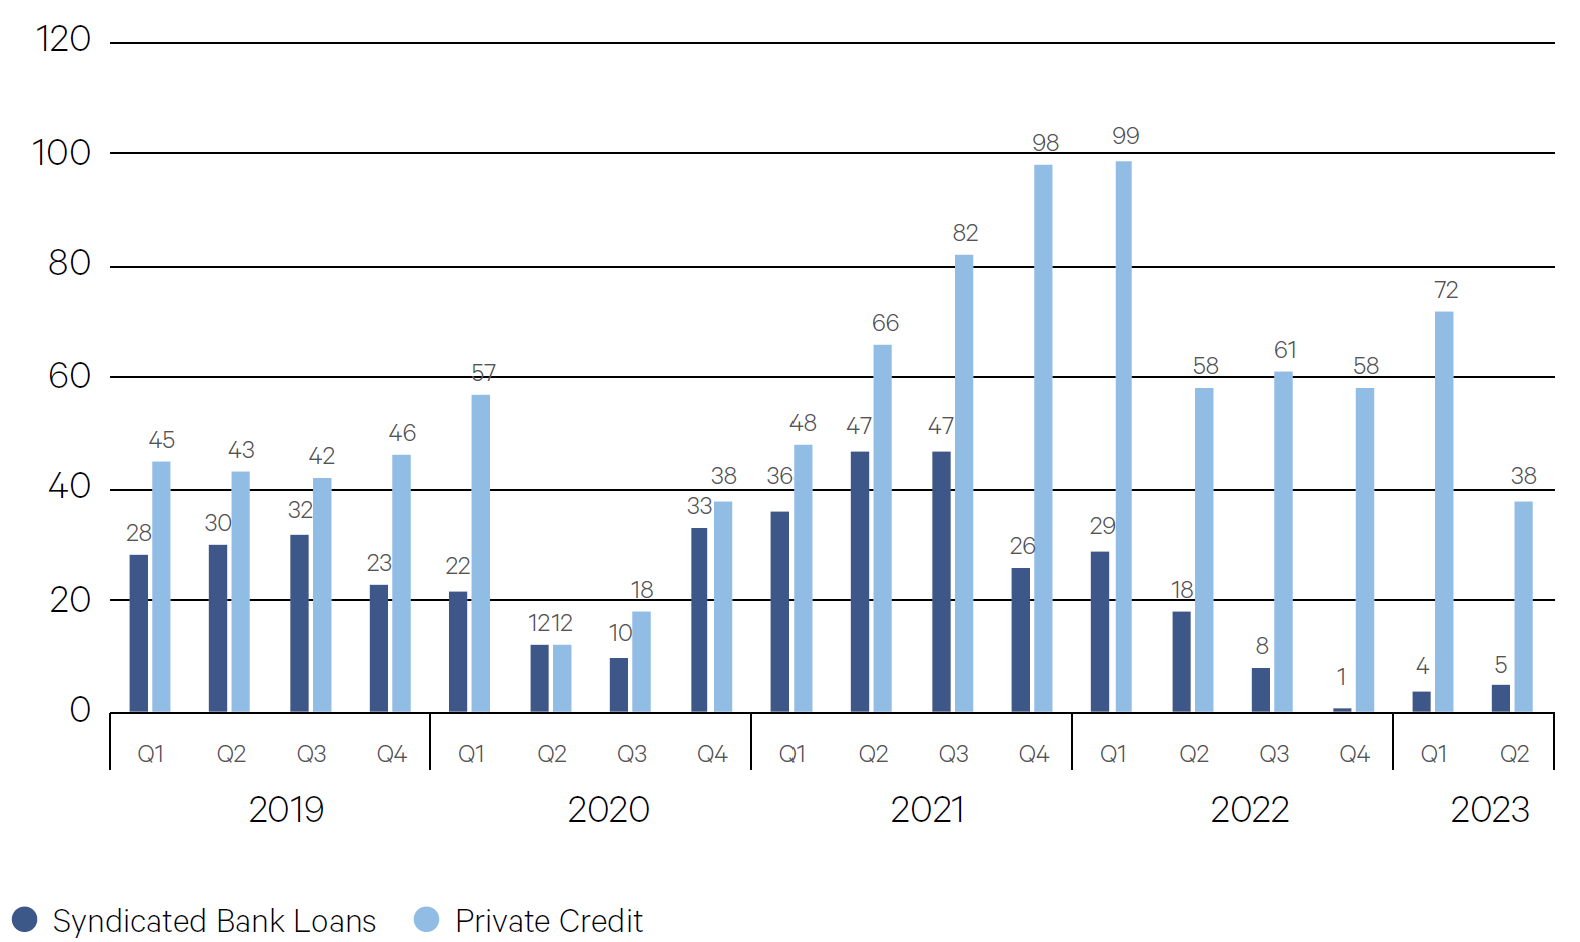
The recent struggles within the US banking system from notable collapses of SVB, Signature Bank and First Republic coupled with deposit flight, higher funding costs and losses on legacy asset portfolios has further constrained the ability of traditional
lenders to provide credit to corporate borrowers. As a result, private credit funds are finding greater opportunities to step in to fill the void left by the traditional banking system. The number of private credit deals continues to grow with above average numbers of deals taking place for all of 2022 and into the beginning of 2023.Chart 11: Private credit continues to fill the gaps left from bank

Source: Pitchbook

Hedge Funds
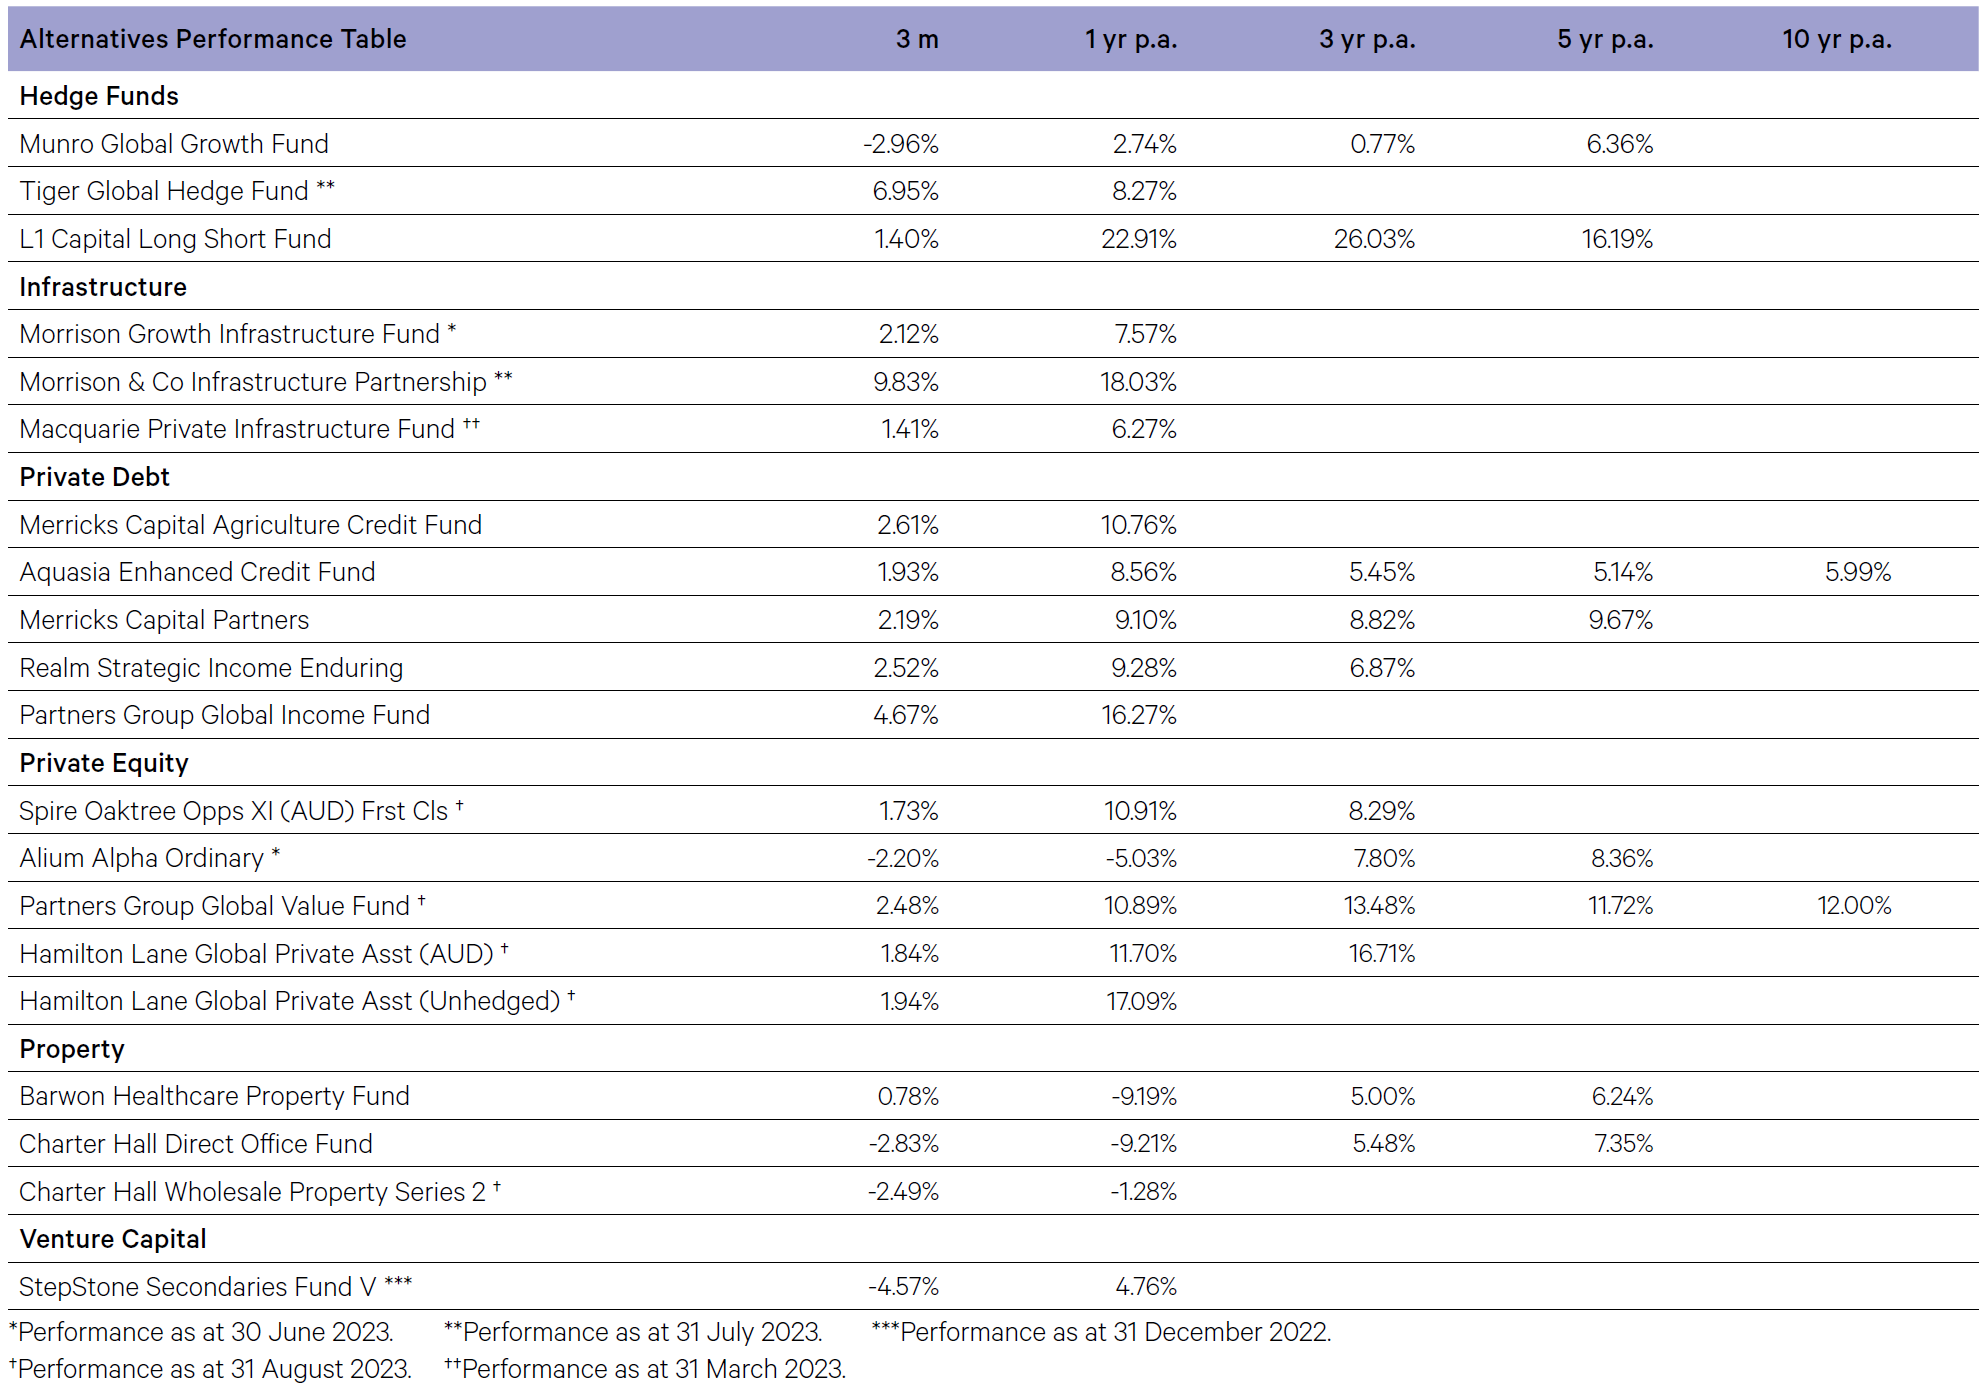
- Equity long short manager L1 Capital Long Short finished the quarter 1.4% against the backdrop of a volatile market environment. During the quarter, stock-specific gains and tailwinds from exposure to energy more than offset the weaker general market backdrop.
- Munro Global Growth finished the quarter -3.0%. The Fund’s long positions detracted from performance in the quarter. Long positions in luxury goods stocks Richemont and LVMH detracted from performance, with soft China economic data and a normalisation of US consumer spending on luxury goods, leading to a significant derating in both stock’s earnings multiples. Short positions modestly benefited performance, with the fall in the Australian dollar also contributing positively to fund performance for the quarter.
- Tiger Global benefited from core positions across ecommerce and fintech. The manager continues to maintain a conservative level of exposure.
Private Equity
- Private equity (PE) activity is beginning to see the first signs of a turnaround from the slowdown in pace of deal flow which characterized much of 2022 and the beginning of 2023. With LBO and direct lending markets now picking up, PE managers are seeing the possibility of executing deals growing. Growth equity and carve-outs continue to gain momentum with the latter a strategy to unlock quality assets at depressed valuations.
- For the three month period ending August 2023 both Partners Group
Global Value Fund (+2.48%) and Hamilton Lane Global Private Assets Fund (+1.84%) both had positive returns. Partners Group gained from direct equity positions in the consumer staples and healthcare sectors, which performed strongly. Hamilton Lane gained from strong performance of secondary PE deals as well as direct equity positions in building materials and IT data providers.
Private Debt
- Merrick’s Partners added 2.2% over the three months ending September 2023. Underlying loan income performed strongly across the quarter, with floating rate loans continuing to pass through rising interest rates in Australia and New Zealand. The portfolio currently comprises senior secured loans diversified across sixteen sub-sectors and is additionally diversified by geographic spread and borrowers. Credit default Swap (CDS) protection continues to provide the Fund with a cost-effective macro credit hedge.
Infrastructure
- The Macquarie Private Infrastructure Fund returned 1.4% over the June quarter. The strongest contributors for the quarter were Australian focused funds and American focused funds, in addition to Europe’s coinvestment into VIRTUS Data Centers. The fund continues to benefit from longer-term structural trends in the sector. Significant opportunities continue to open up for investment into next generation infrastructure such as renewable energy and digitization.
- The Morrison & Co Infrastructure Property Fund has performed strongly in recent quarters following the revaluation of some key portfolio positions in the digital infrastructure space, with cell towers and fiber businesses in Australia adding strongly to returns as revenue volumes continue to grow in both areas.
Property
- Valuations across property markets continued to soften in the third quarter as higher interest rates continue to force cap rates to widen from historically tight levels in 2021/22. For the quarter, the Charter Hall Direct Office Fund finished -2.8% lower, albeit avoiding some of the biggest declines in the direct office market. Barwon Healthcare Property Fund finished up 0.8% as income yield on the fund’s properties remained strong throughout the quarter. The fund’s properties continue to have a strong tenant profile with 08% occupancy across the fund.
