-
So much for
that recessionSo where is this recession that everyone ordered? The main story over the past couple of months has been about reducing the probability of a US recession that was raised around the US regional bank crisis in March. The crisis, which produced the two largest bank failures in US history, resulted in a 100% probability that the US Federal Reserve would be cutting interest rates by now. Since then, in the space of just three months, that probability has flipped to a 95% probability that interest rates would be increased at the next meeting in July.
So what happened? Is the recession just delayed or is it going to be denied completely?
1. What recession?
The US economy has demonstrated remarkable resiliency in the face of the most aggressive interest rate hiking cycle in 40 years. Monetary policy tightening began in May last year. Since then, interest rates have been lifted by 500 basis points – double the average since 1988 in almost half the time.
And yet, consumers (who make up two-thirds of the entire economy) continue to spend. Part of the explanation for this is the sheer size of the stimulus injected into the economy during the pandemic. The other part of the explanation is that jobs are plentiful, and wages are growing. This is particularly the case in the services sector. Manufacturing is in recession, but it employs less than 10% of the workforce. Service sector share of employment is 80% and it is still growing. So, 80% of the workforce is supporting 67% of the economy.
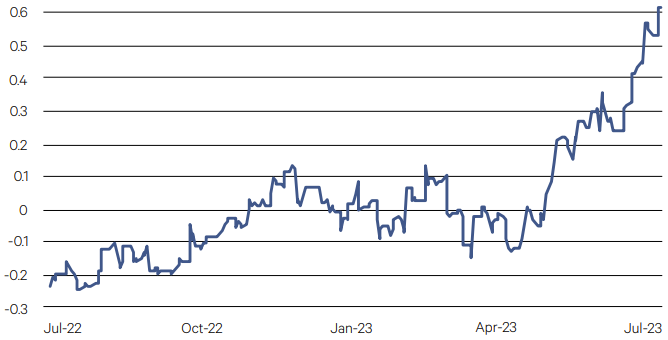
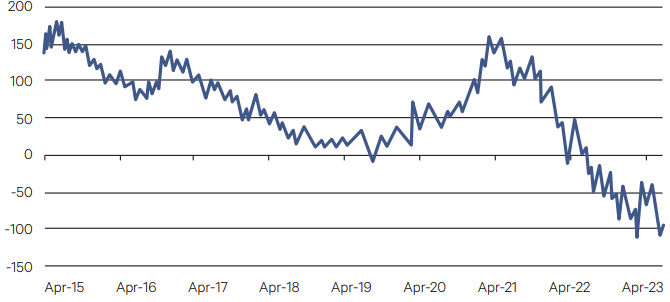
There is some, albeit limited, evidence of a slowdown in service sector activity, and signs the stimulus savings surplus is shrinking, but little response yet in the form of service sector job cuts. Until that happens, the economy will remain surprisingly resilient. This surprise is shown in the Economic Surprise Index.
Chart 1: US Economic Surprise Index

Source: Bloomberg
2. What inflation?
Your view on inflation depends on what kind of inflation you are looking at. US inflation at the headline level has come down – from a peak of 9.1% to 3% currently. Quite a dramatic decline in just one year. But it is too early to declare victory just yet.
Most of the decline has been from lower goods prices which makes sense if manufacturing is in recession. Core goods inflation is running at just 1.3% having fallen from a peak of 12% in February last year.
Core services inflation, however, where all the economic heat is currently being generated, is running at 6.2%. This is down less dramatically from a peak of 7.3% in February this year.
It goes without saying, inflation will slow when demand slows. Demand will slow when the pandemic savings have been spent and when jobs are harder to come by. Despite recent rapid drawdowns, estimates from the Federal Reserve suggest a substantial stock of excess pandemic savings remains – enough to potentially support consumers for the remainder of this year. And while the services sector is slowing, it is still in expansion mode. So, the job of fighting inflation is far from done. And if history is any guide, it may take longer than expected.
Chart 2: US Core Goods and Services CPI (yoy%)

Source: Bloomberg
3. Digging in
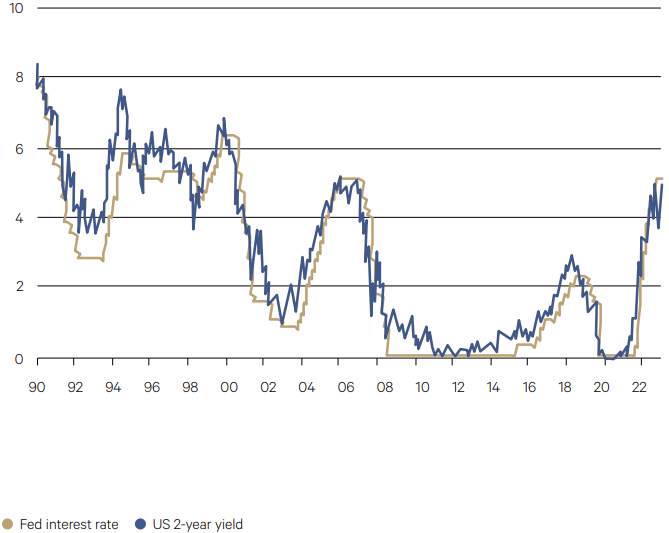
In the face of this resiliency, the US Federal Reserve has no other choice but to dig in. Interest rates will need to stay higher for longer. The issue with not bringing down inflation quickly has been laid bare in the UK where a wage-price spiral has developed – higher wages beget higher prices beget higher wages, and so on.
The unintended consequences of a central bank that will need to dig in is the damage still higher interest rates will have on the economy. So, a recession may be delayed but in no way will it be denied.
Chart 3: US 2-year Bond Yield and Fed Interest Rate (%)

Source: Bloomberg
-
Australian Equities

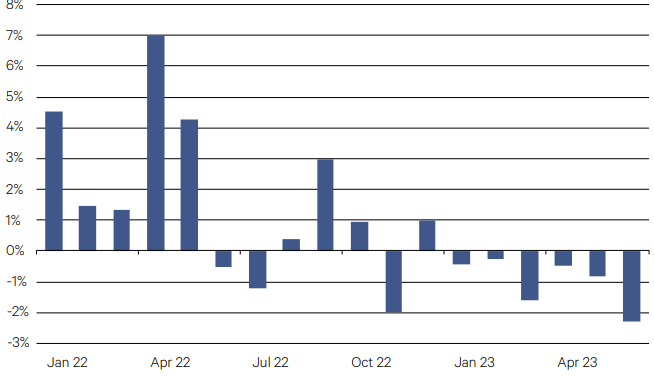
After a year of robust earnings strength for the Australian market in 2022, this momentum has stalled so far in 2023, with the ASX 200 Index experiencing six consecutive months of negative earnings revisions, with prior tailwinds turning into headwinds. Among the key drivers of the weakness has been commodity prices falling from recent peaks, the major banks dialling back expectations of further expansion in net interest margins and in the last few months, a raft of downgrades across industrial companies more exposed to discretionary consumer spending.
Chart 4: Earnings soften in the Australian market – ASX 200 monthly earnings revisions

Source: Bloomberg
Following a further rise in long bond yields and equities edging higher, the earnings yield premium for the ASX 200 over the Australian 10-year government bond yield has compressed further. Over the last 10 years, this yield premium has averaged 4%, however this has now dropped below 3% for the first time since 2013 indicating that equities are now relatively expensive to bonds.
Chart 5: Yield premium on Australian equities contracts as bond yields rise

Source: Bloomberg

- The Australian equity market eked out a positive quarter for the three months to 30 June, contributing to a solid 14.8% total return for the financial year.
- The domestic market lagged other key developed market returns for the quarter however, particularly that of the US. The US rally was driven by a small cohort of stocks linked to the artificial intelligence (AI) theme and hence Australia’s limited exposure to the information technology sector saw it lag international equities.
- The positive return for the quarter was achieved despite a renewed rise in bond yields after economic and inflation data led to a further two rate hikes by the RBA with the central bank leaving open the option of further monetary policy tightening in the months ahead.
- The materials sector was a key laggard for the quarter as commodity prices fell on the back of disappointing economic data on China’s reopening. Consumer discretionary stocks also underperformed with several downgrades starting to filter through the market.
- Among our large cap managers, Selector generated the strongest returns for the quarter. Selector’s overweight position in IT companies was a positive over the three months, which followed the AI-driven gains of the US market.
- The Chester High Conviction fund was another strong performer in the quarter with returns over the quarter driven by stock-specific gains as opposed to any over-arching macroeconomic themes.
- Small caps again lagged large caps in the June quarter, extending a long stretch of underperformance. Despite this, on aggregate our managers were able to generate strong alpha above that of the index.
- This included Fairview Emerging Companies who rounded off a solid financial year by outperforming the Small Ordinaries Accumulation Index by 5% in the quarter. The result was achieved on the back of good stock selection while avoiding the key sectors of the market that suffered profit warnings in the lead up to August’s reporting season.
-
International Equities
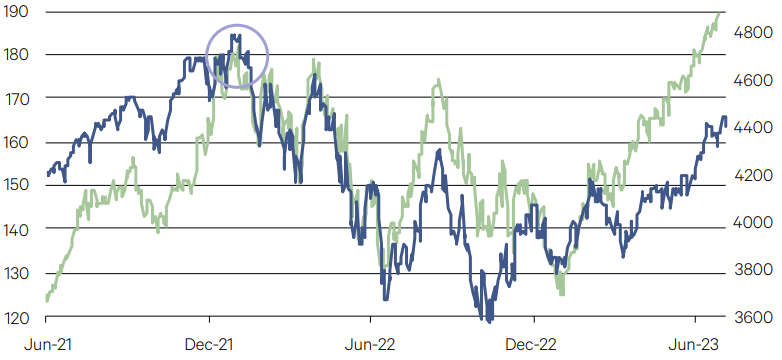
A fresh all-time high was hit on the last day of trading in the quarter for the largest S&P 500 member (7.5% weight) – Apple, taking it to a market worth of $US3.05 trillion. The stock is up 49% so far this year. At 32 times projected earnings, Apple is looking expensive not only against its 10-year average PE of 18, but also for a firm whose revenue is expected to shrink this year. Apple’s balance sheet is in rude health generating more than $US100 billion in free cash flow in a year. It raised its dividend and announced plans for $US90 billion in stock repurchases. Those repurchases now leave just 15.7 billion in shares outstanding, down more than 40% from 2012.
Chart 6: Apple Inc

Source: Bloomberg
The last time Apple hit a new all-time high was on the 3rd January 2022, the very same day that the S&P500 hit a record high. This time around, Apple is on its own, outpacing the broader market by a considerable margin. Over the quarter, Apple is up 17.6% while the S&P500 is up a “just” 8.3%. This reflects the narrow breadth of the rise in the market where most of the gains have come from a handful of stocks. The IT and consumer discretionary sectors (home to Tesla and Amazon) led the gains (up 17% and 14% respectively) and together make up 38% of the broader index. The underperformers, utilities, consumer staples and energy (down 3%, 0.2% and 1.8% respectively) make up 13% of the index. This comes after even wider dispersion in sector returns in Q1: 21% and 16% for IT and consumer discretionary against -6% for financials and energy. Typically, such dispersion sees broader indexes falter.
Chart 7: The Broader Market Lags Apple

Source: Bloomberg


- The MSCI World Index rose 6.3% in the quarter. The narrow rally in technology related names helped keep the S&P 500 aloft and the resolution of the US debt ceiling debate removed some uncertainty premium. The S&P 500 index closed the second quarter up by 8.3% while the Nasdaq added another 12.8% to its 16.8% gain in Q1. Artificial intelligence turbocharged the returns for a few companies.
- European shares underperformed the US with banking contagion risks fading and China’s economic re-opening missing its mark.
- Emerging market (EM) equities were unchanged over the quarter with the 7.8% slump in Chinese equities offset by the 15.9% gain in Brazil. China’s growth recovery remains weak and policy measures remain small and targeted. This has particularly affected our Asian equities fund from Fidelity. The Japanese Nikkei was a standout rising by 18.4% as activist investors make some headway in encouraging Japanese corporates to use their lazy balance sheets more efficiently.
- Growth stocks rose, as did large cap (outperforming small) while cyclical sectors that rely on strength in the economy – like large industrials and airlines – were resilient. Defensive shares were more subdued but still finished in the black.
- The Australian dollar fell 0.3% against the US dollar but fell more against the euro and UK pound. Global funds that were unhedged therefore benefited.
- The rise in bond yields over the quarter didn’t detract from the performance put in by our growth-heavy funds. This was particularly the case for the Loftus Peak Global Disruption Fund where the investments in artificial intelligence rose strongly. This was particularly the case for the Funds investment in Advanced Micro Devices (+16.2% Q2) and Nvidia (+52.3% Q2).
- Royal London generated a solid performance boosted particularly by its holdings in Microsoft (+18.4% Q2) and Amazon (+26.2% Q2).
- Our newest international equity fund, Barrow Hanley, benefited from its holding in Oracle (+28.7% Q2) and HSBC (+14.6% Q2).
-
Fixed Income
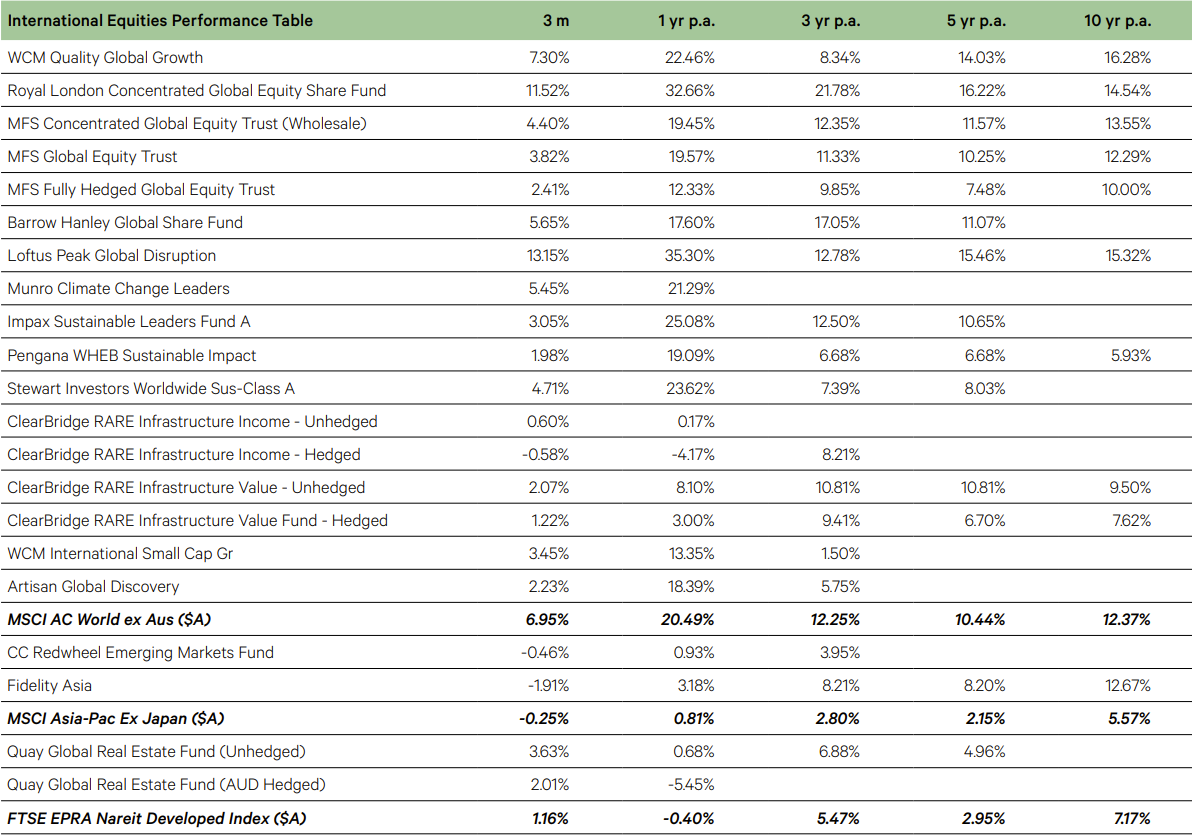
Central bank policy is starting to diverge as the inflationary impulse is now wildly different across various
jurisdictions. China is flirting with deflation, the US passed its peak 12 months ago, Australia’s core inflation rate has only just done so and rates in the UK are still accelerating. The schism is probably being driven by the differing states of health in manufacturing and services. The services sector, where inflation is the stickiest, is still expanding in the UK. In Australia and the US it is bordering on contraction territory. In the UK, nearly 5 more rate hikes are being priced by the market before year-end. This compares with just over one in the US and 1.5 in Australia.Chart 8: Core/Underlying Inflation (yoy%)

The US yield curve will this week celebrate one year of inversion with little to suggest it will normalise anytime soon. The 2s10s yield curve inversion is famously a harbinger of economic doom, with a solid track record predicting all the recent recessions. So, an inverted curve speaks of a possible contraction ahead. But history has shown that it’s not when the curve is inverted that you want to worry, it’s when it un-inverts, i.e. steepens. The past three recessions (and the pandemic) all came after the yield curve had turned positive again. A steeper yield curve implies rate cuts being brought forward and for now those have been priced out for this year in the wake of better-than-expected economic data.
Chart 9: Recession Looming, but Maybe Later Than Expected

Source: Bloomberg

- Government bond yields rose in the quarter and yield curves generally flattened as short-term rates rose more than longer term yields. This had a negative impact on the funds that had a high allocation to duration such as WAM Australian Bond Fund and the Bentham Global Income Fund.
- 10-year government bond yields rose by 73 basis points in Australia, on the resumption of rate hikes and still high inflation, and by 37 basis points in the US. The US Federal Reserve raised rates once and the Reserve Bank of Australia raised interest rates twice over the quarter taking the official interest rate to 5.25% and 4.1% respectively.
- The increase in yields weighed on investment grade credit where duration risk is higher. High yield credit benefited from higher yields. The rise in yields benefited our floating rate credit funds such as Perpetual Credit Income and the Realm High Income Fund.
- The rise in bond yields over the quarter weighed the returns of the funds in our duration bucket. This was particularly the case for the Legg Mason Western Asset Management Australian Bond Fund.
- Our liquidity funds, Realm and Alexander, performed in-line with expectations for the quarter.
-
Alternatives
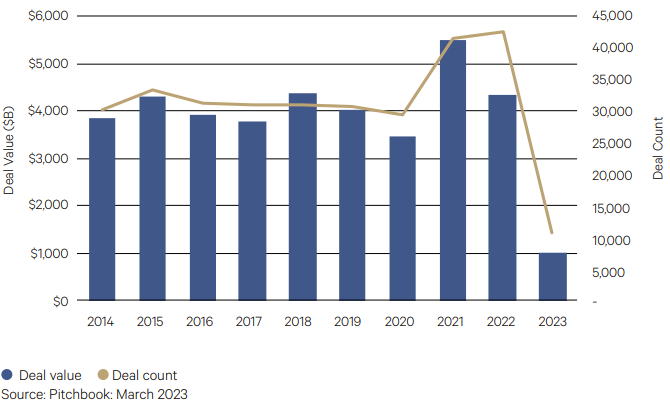
Global M&A faltered in Q1 2023. Deal value retraced Q4 2022’s modest gain and is now down 32.2% from the Q4 2021 peak. The macroeconomic backdrop that drove the decline in 2022 persisted in the new year. Still, dealmakers managed to overcome those challenges and post another quarter in which deal value was just shy of $1 trillion.
Lower valuations now available to Private Equity and corporate buyers have helped prop up deal flow and avoid an even steeper decline. Q1 2023 deal value declined by 10.0%, pushing below a sluggish Q3 2022. Quarterly deal flow is now on par with pre-COVID-19 levels (up 37.9% by count), defined as the 12 quarters spanning 2017 through 2019. At the time these were considered very good quarters and years for M&A.
Chart 10: M&A Activity

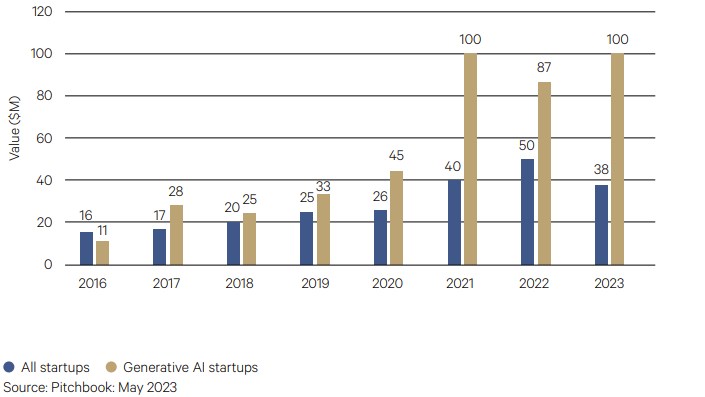
The contrast between generative AI and all other startups is becoming increasingly evident in valuations data. Investors are measuring generative AI and all other startups on very different criteria: the first on sheer potential and the latter on revenue. Compared to 2022, median pre-money valuations for early-stage rounds (Series A and B) of generative AI companies have jumped by 16% so far this year, according to PitchBook data. Meanwhile, prices for all other startups raising a Series A or Series B have dropped by nearly 24%. More recently, there have been a number of generative AI startups having raised Series A rounds at very healthy valuations. Examples include companies such as Rewind and LangChain.
Chart 11: Dispersion in Valuations of Generative AI and other Startups


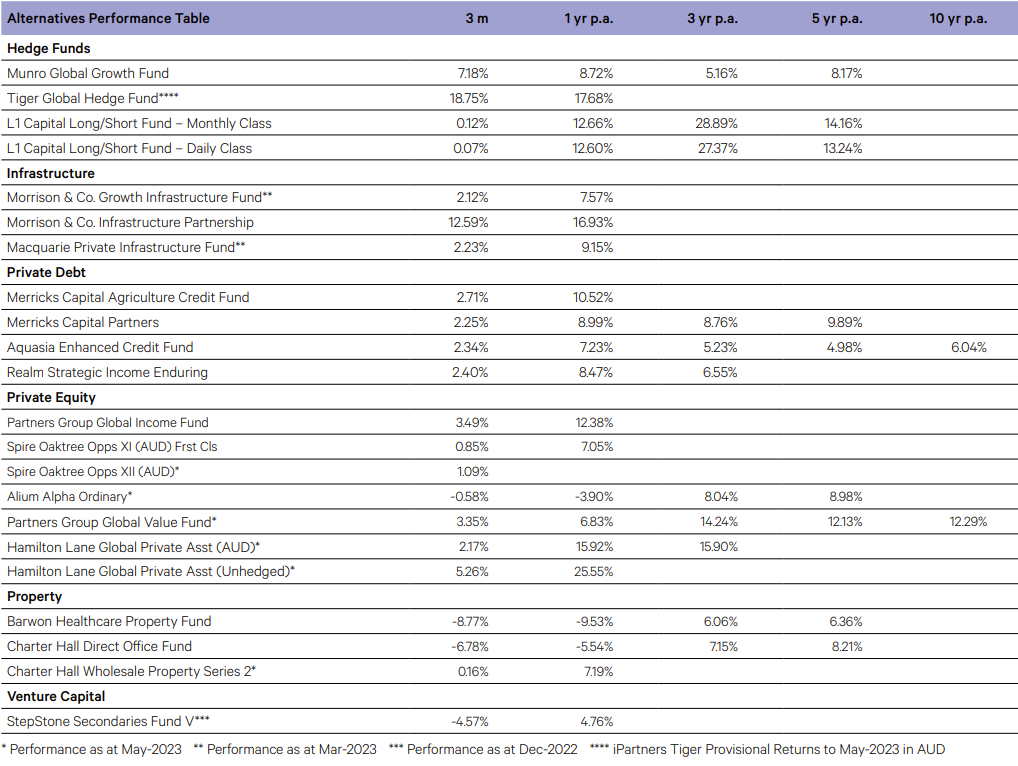
Hedge Funds
- Equity long short manager Munro Global Growth finished the quarter up 7.18%. The fund’s gains were driven in May as the market rallied. Long equities, currencies and portfolio hedging all contributed to performance. Some of the largest contributors came from the High-Performance Compute Area of Interest – ASML, Nvidia, Synopsys and TSMC, all benefiting from the rise of AI. From a portfolio perspective, the manager remains encouraged by earnings outlooks of the portfolio holdings. Across the quarter the Fund fully deployed the portfolio’s excess cash and is now fully invested.
- In a similar manner, Tiger Global benefited from core positions across ecommerce and fintech. The manager continues to maintain a conservative level of exposure.
Private Equity
- Private Equity (PE) activity continued to slow over the first half of 2023 as large PE fund managers continue to sit on record amounts of dry powder in the anticipation of valuations falling on companies they are monitoring. Managers are continuing to favour add-on style investments at lower multiples for existing portfolio companies over outright new acquisitions for their portfolio’s.
- Over the three-month period ending May-2023 Partners Group Global Value Fund added 3.4% whilst Hamilton Lane Global Private Assets Fund gained 2.2%. Partners Group had positive attribution from software and luxury goods companies. Hamilton Lane gained from investments in the PE secondaries market where they have been able to acquire portfolios of assets at an attractive discount to NAV.
Private Debt
- Merrick’s Partners added 2.2% over the three months ending May 2023. Underlying loan income performed strongly across the quarter with floating rate loans continuing to pass through rising interest rates in Australia and New Zealand. The portfolio currently comprises senior secured loans diversified across sixteen sub-sectors and is additionally diversified by geographic spread and borrowers. Credit default Swap (CDS) protection continues to provide the fund with a cost-effective macro credit hedge.
Property
- Valuations in some sectors of commercial real estate (CRE) have softened this year as capitalisation rates widened due to higher interest rates continuing to hurt demand for many sectors of CRE. As a result of this uncertainty in valuations, activity in Australian CRE has fallen by 50% in H1 2023 compared with the same period a year earlier.
- In Q2 2023 Barwon Healthcare Property Fund fell by 8.77% for the quarter. The firm undertook a full revaluation on all portfolio properties to account for this softness in market cap rates however they remain positive on the outlook for the fund as occupancy across the portfolio remains unchanged at 98%, and lease expiry remains at 6 years whilst rental income continues to grow.
Infrastructure
- The Macquarie Private Infrastructure Fund returned 2.2% over the March quarter. The strongest contributors for the quarter were Australian and European focused funds. At an asset level, Australia’s North Queensland Airports and Europe’s VIRTUS Data Centres were meaningful positive contributors to their respective underlying funds. The fund continues to benefit from longer-term structural trends in the sector. Significant opportunities continue to open for investment into next generation infrastructure such as renewable energy and digitisation.